

Question: 2. Table below contains information on actual and predicted GDPs per capita expressed relative to the country A, predicted productivities expressed relative to the
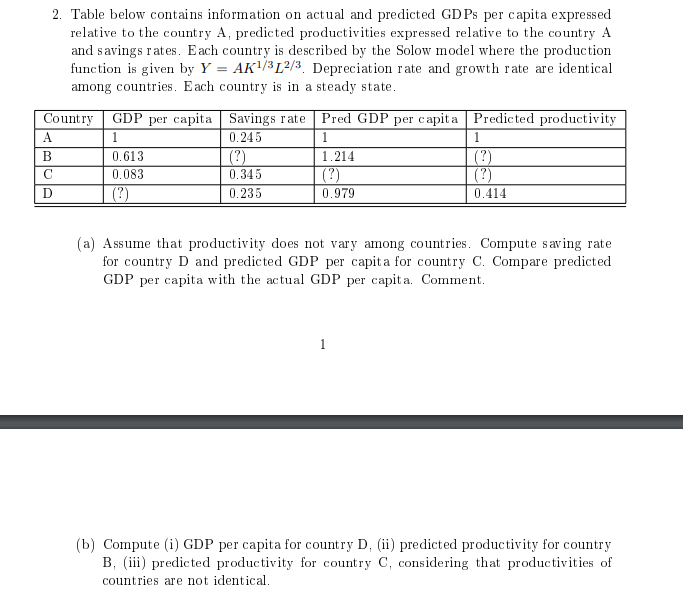
2. Table below contains information on actual and predicted GDPs per capita expressed relative to the country A, predicted productivities expressed relative to the country A and savings rates. Each country is described by the Solow model where the production function is given by Y = AK/312/3. Depreciation rate and growth rate are identical among countries. Each country is in a steady state. Country GDP per capita Savings rate 1 0.245 A B C D 0.613 0.083 (?) (?) 0.345 0.235 Pred GDP per capita Predicted productivity 1 1.214 (?) 0.979 1 (?) (?) 0.414 (a) Assume that productivity does not vary among countries. Compute saving rate for country D and predicted GDP per capita for country C. Compare predicted GDP per capita with the actual GDP per capita. Comment. (b) Compute (i) GDP per capita for country D, (ii) predicted productivity for country B, (iii) predicted productivity for country C, considering that productivities of countries are not identical.
Step by Step Solution
There are 3 Steps involved in it
a Assuming productivity does not vary among countries we can compute the saving rate for country D a... View full answer

Get step-by-step solutions from verified subject matter experts