

Question: 2. The 88 picture given below: (range: 0 to 9 ) a) Draw the histogram. b) Apply histogram equalization according to the equation given below
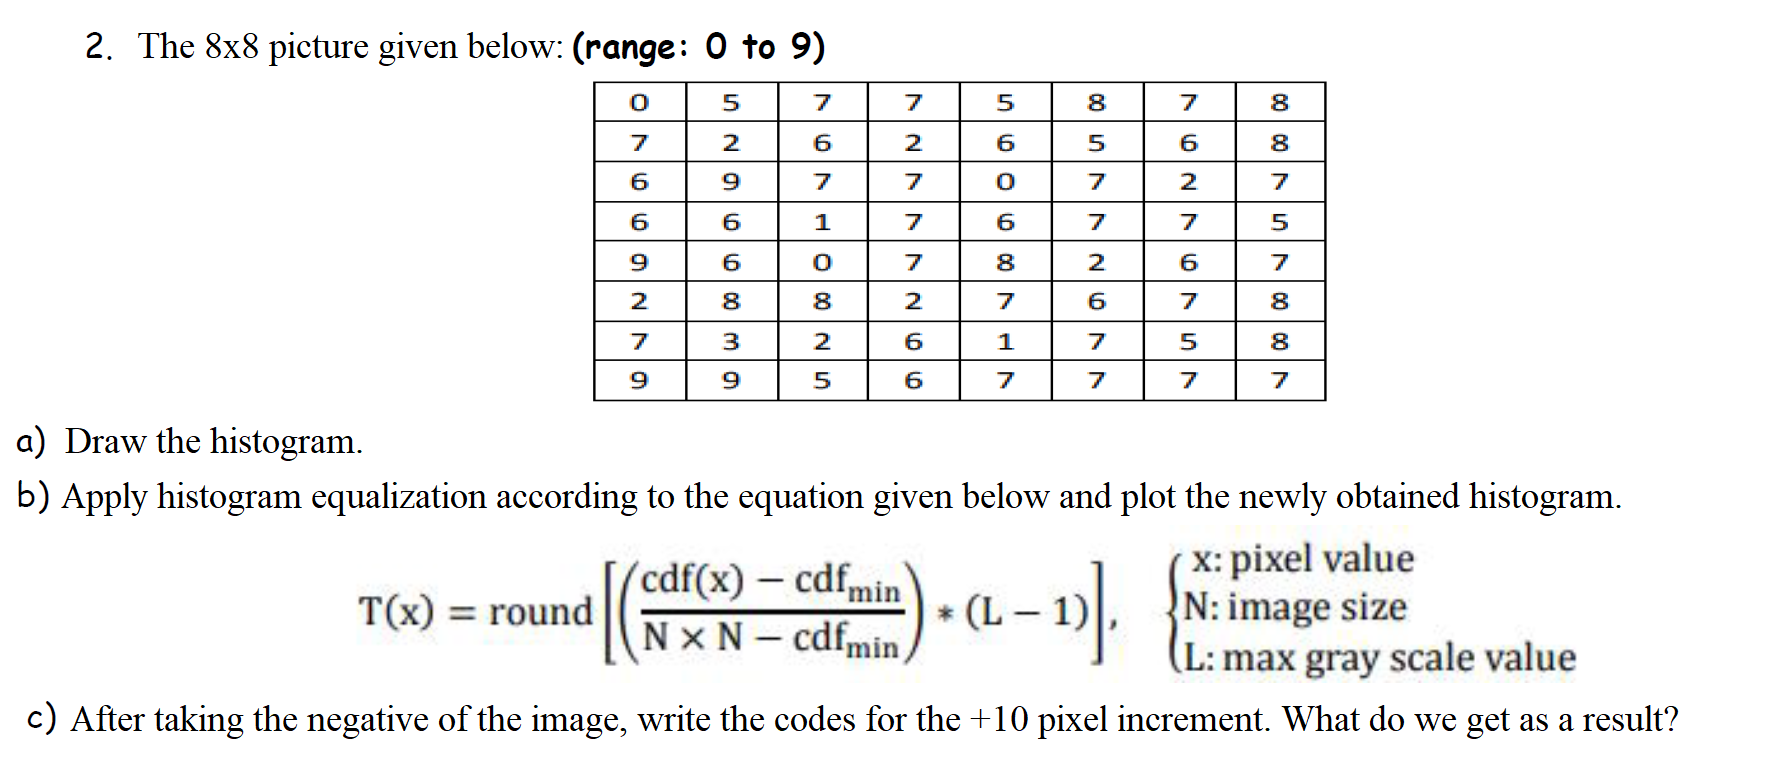
2. The 88 picture given below: (range: 0 to 9 ) a) Draw the histogram. b) Apply histogram equalization according to the equation given below and plot the newly obtained histogram. T(x)=round[(NNcdfmincdf(x)cdfmin)(L1)],x:pixelvalueN:imagesizeL:maxgrayscalevalue c) After taking the negative of the image, write the codes for the +10 pixel increment. What do we get as a result
Step by Step Solution
There are 3 Steps involved in it
1 Expert Approved Answer
Step: 1 Unlock

Question Has Been Solved by an Expert!
Get step-by-step solutions from verified subject matter experts
Step: 2 Unlock
Step: 3 Unlock