

Question: 2. The data below contains the amount that a sample of nine customers spent for lunch ($) at a fast- food restaurant: 4.20 5.03 5.86
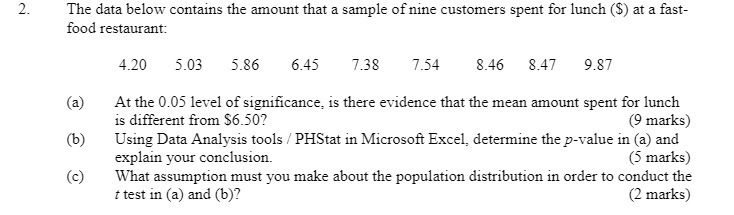
2. The data below contains the amount that a sample of nine customers spent for lunch ($) at a fast- food restaurant: 4.20 5.03 5.86 6.45 7.38 7.54 8.46 8.47 9.87 (a) At the 0.05 level of significance, is there evidence that the mean amount spent for lunch is different from $6.50? (9 marks) (b) Using Data Analysis tools / PHStat in Microsoft Excel, determine the p-value in (a) and explain your conclusion. (5 marks) (c) What assumption must you make about the population distribution in order to conduct the * test in (a) and (b)? (2 marks)
Step by Step Solution
There are 3 Steps involved in it
1 Expert Approved Answer
Step: 1 Unlock

Question Has Been Solved by an Expert!
Get step-by-step solutions from verified subject matter experts
Step: 2 Unlock
Step: 3 Unlock