Question: 2. The data set c6p13 contains quarterly data on Upper Midwest car sales (CS) in thousands for 1996Q1 through 2016Q4. Atime-series plot of Upper Midwest
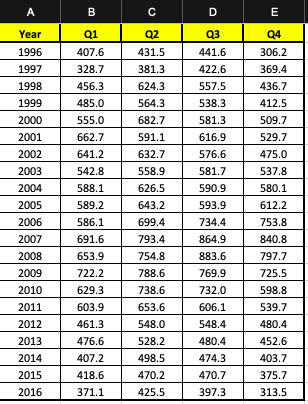
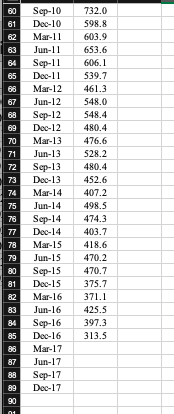
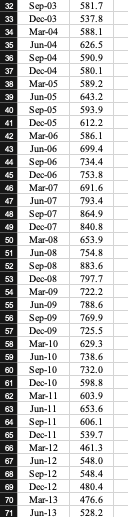
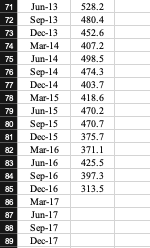
2. The data set c6p13 contains quarterly data on Upper Midwest car sales (CS) in thousands for 1996Q1 through 2016Q4.
Atime-series plot of Upper Midwest car sales from 1996Q1 through 2016Q4.
B. How would you calculate trend (T), seasonal index (S) and the cyclical factors (C)? If S=0.95, 1.07, 1.05, 0.93 for Q1, Q2, Q3, and Q4, respectively, what do they mean?
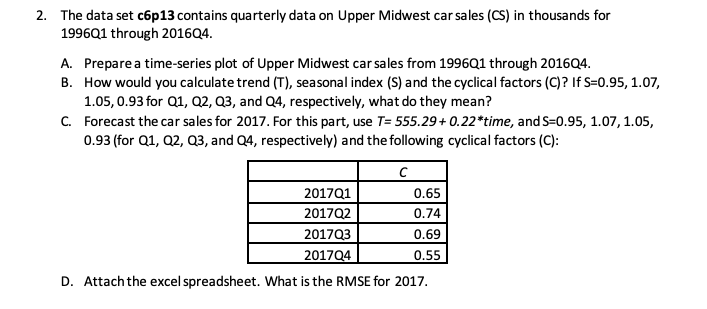
C. Forecast the car sales for 2017. For this part, use T= 555.29 + 0.22*time, and S=0.95, 1.07, 1.05, 0.93 (for Q1, Q2, Q3, and Q4, respectively) and the following cyclical factors (C):
C 2017Q1 0.65 2017Q2 0.74 2017Q3 0.69 2017Q4 0.55 D. Attach the excel spreadsheet. What is the RMSE for 2017.
A B C D E Year Q1 02 03 04 1996 407.6 431.5 441.6 306.2 1997 328.7 381.3 422.6 369.4 1998 456.3 624.3 557.5 436.7 1999 485.0 564.3 538.3 412.5 2000 555.0 682.7 581.3 509.7 2001 662.7 591.1 616.9 529.7 2002 641.2 632.7 576.6 475.0 2003 542.8 558.9 581.7 537.8 2004 588.1 626.5 590.9 580.1 2005 589.2 643.2 593.9 612.2 2006 586.1 699.4 734.4 753.8 2007 691.6 793.4 864.9 840.8 2008 653.9 754.8 883.6 797.7 2009 722.2 788.6 769.9 725.5 2010 629.3 738.6 732.0 598.8 2011 603.9 653.6 606.1 539.7 2012 461.3 548.0 548.4 480.4 2013 476.6 528.2 480.4 452.6 2014 407.2 498.5 474.3 403.7 2015 418.6 470.2 470.7 375.7 2016 371.1 425.5 397.3 313.52. The data set c6p13 contains quarterly data on Upper Midwest car sales (CS) in thousands for 199601 through 201604. A. Prepare a time-series plot of Upper Midwest car sales from 199601 through 201604. B. How would you calculate trend (T), seasonal index (S) and the cyclical factors (C)? If S=0.95, 1.07, 1.05, 0.93 for Q1, Q2, Q3, and Q4, respectively, what do they mean? C. Forecast the car sales for 2017. For this part, use T= 555.29+ 0.22*time, and S=0.95, 1.07, 1.05, 0.93 (for Q1, Q2, Q3, and Q4, respectively) and the following cyclical factors (C): C 2017Q1 0.65 201702 0.74 201703 0.69 201704 0.55 D. Attach the excel spreadsheet. What is the RMSE for 2017.80 Sep-10 732.0 81 Doc-10 598.8 82 Mar-1 1 603.9 83 Jun-11 653.6 84 Sep-11 606.1 85 Doc-11 539.7 68 Mar-12 461.3 87 Jun-12 548.0 68 Sep-12 548.4 69 Doc-12 480.4 70 Mar-13 476.6 71 Jun-13 528.2 72 Sep-13 480.4 73 Doc-13 452.6 74 Mar-14 407.2 75 Jun-14 498.5 78 Sep-14 474.3 77 Doc-14 403.7 78 Mar-15 418.6 79 Jun-15 470.2 80 Sep-15 470.7 81 Doc-15 375.7 82 Mar-16 371.1 83 Jun-16 425.5 84 Sep-16 397.3 85 Doc-16 313.5 Mar-17 87 Jun-17 88 Sep-17 89 Doc-17 9032 Sep-03 581.7 33 Doc-03 537.8 Mar-04 588. 1 35 Jun-04 626.5 38 Sep-04 590.9 37 Doc-04 580.1 38 Mar-05 589.2 Jun-05 643.2 Sep-05 593.9 Doc-05 612.2 Mar-16 586.1 Jun-06 699.4 Sep-06 734.4 15 Doc-06 753.8 Mar-07 691.6 Jun-07 793.4 Sep-07 864.9 Doc-07 840.8 50 Mar-08 653.9 51 Jun-08 754.8 52 Sep-08 883.6 53 Doc-08 797.7 54 Mar-09 722.2 55 Jun-09 788.6 58 Sep-09 769.9 57 Doc-09 725.5 58 Mar-10 629.3 59 Jun-10 738.6 Sep-10 732.0 81 Doc-10 598. 8 182 Mar-1 1 613.9 83 Jun-11 653.6 84 Sep-11 606.1 85 Doc-1 1 539.7 Mar-12 461.3 Jun-12 548.0 Scp-12 548.4 Doc-12 480.4 70 Mar-13 476.6 Jun-13 528.271 Jun-13 528.2 72 Sep-13 480.4 73 Doc-13 452.6 74 Mar-14 407.2 75 Jun-14 498.5 78 Sep-14 474.3 77 Doc-14 403.7 78 Mar-15 418.6 79 Jun-15 470.2 80 Sep-15 470.7 81 Doc-15 375.7 82 Mar-16 371.1 83 Jun-16 425.5 84 Sep-16 397.3 85 Doc-16 313.5 88 Mar-17 87 Jun-17 88 Sep-17 89 Doc-17