

Question: 2. The data used in the table below came from independent and random samples. Group 183 128.4 19.8 147.8 23.5 151.3 25.3 131.5 21.5 a.
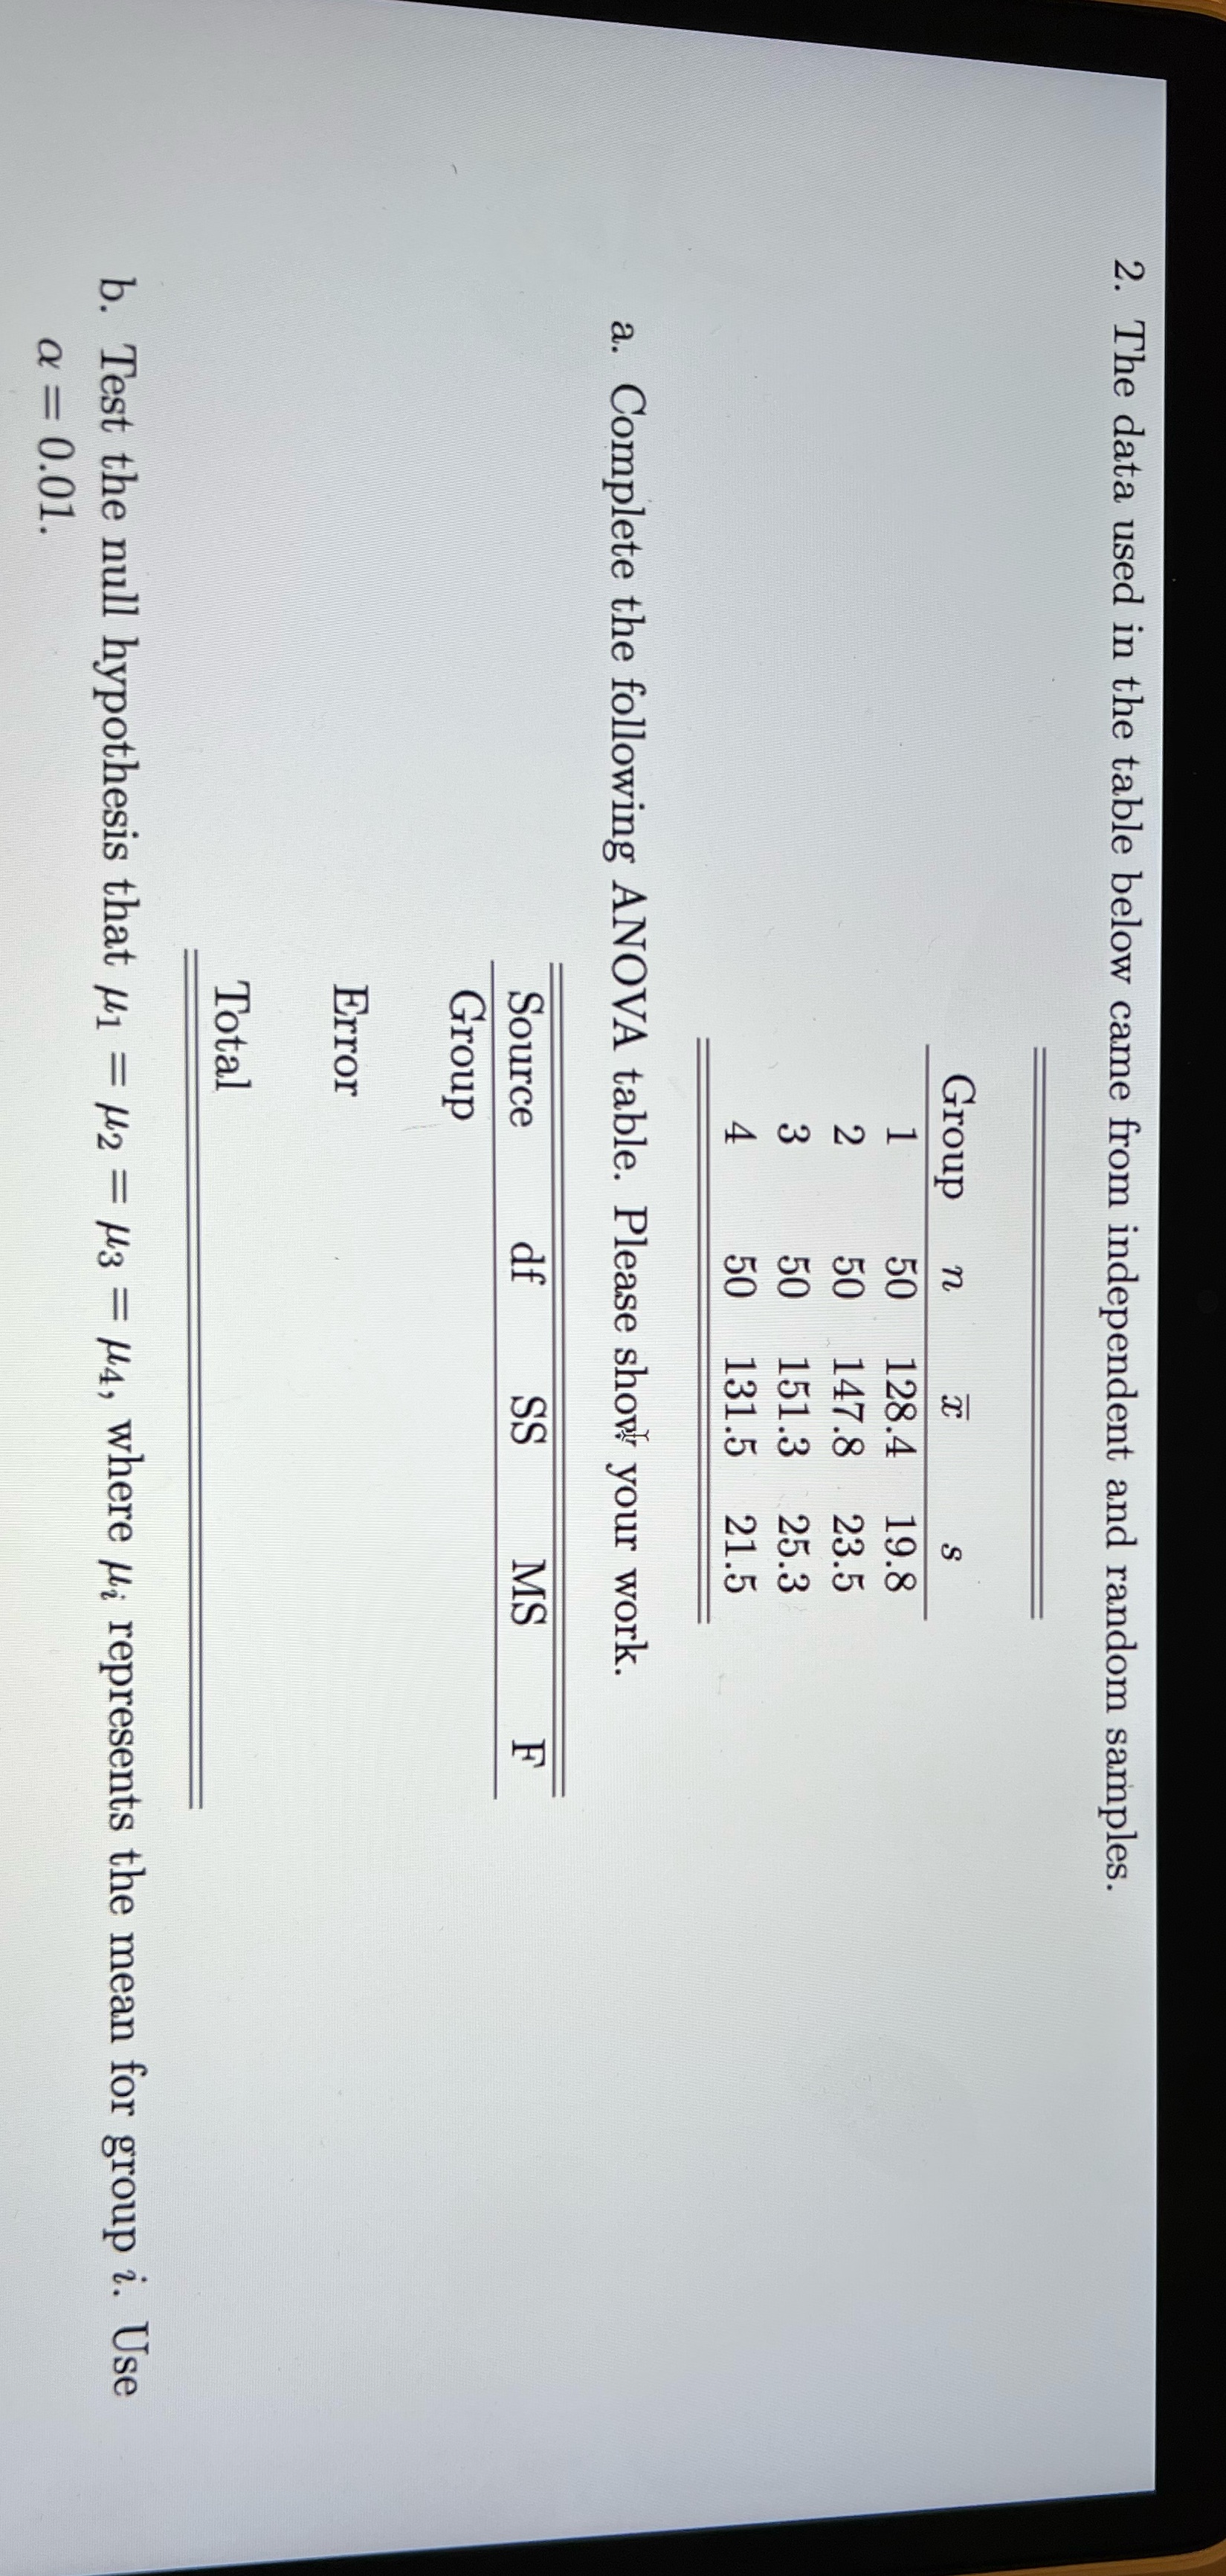
2. The data used in the table below came from independent and random samples. Group 183 128.4 19.8 147.8 23.5 151.3 25.3 131.5 21.5 a. Complete the following ANOVA table. Please show! your work. Source MS Group Error Total b. Test the null hypothesis that /1 = /2 = /3 = /4, where u represents the mean for group i. Use a = 0.01
Step by Step Solution
There are 3 Steps involved in it
1 Expert Approved Answer
Step: 1 Unlock

Question Has Been Solved by an Expert!
Get step-by-step solutions from verified subject matter experts
Step: 2 Unlock
Step: 3 Unlock