

Question: 2) The explanatory variable is plotted on the horizontal axis (x-axis). The response variable is plotted on the vertical axis (y-axis). Identify the variable that
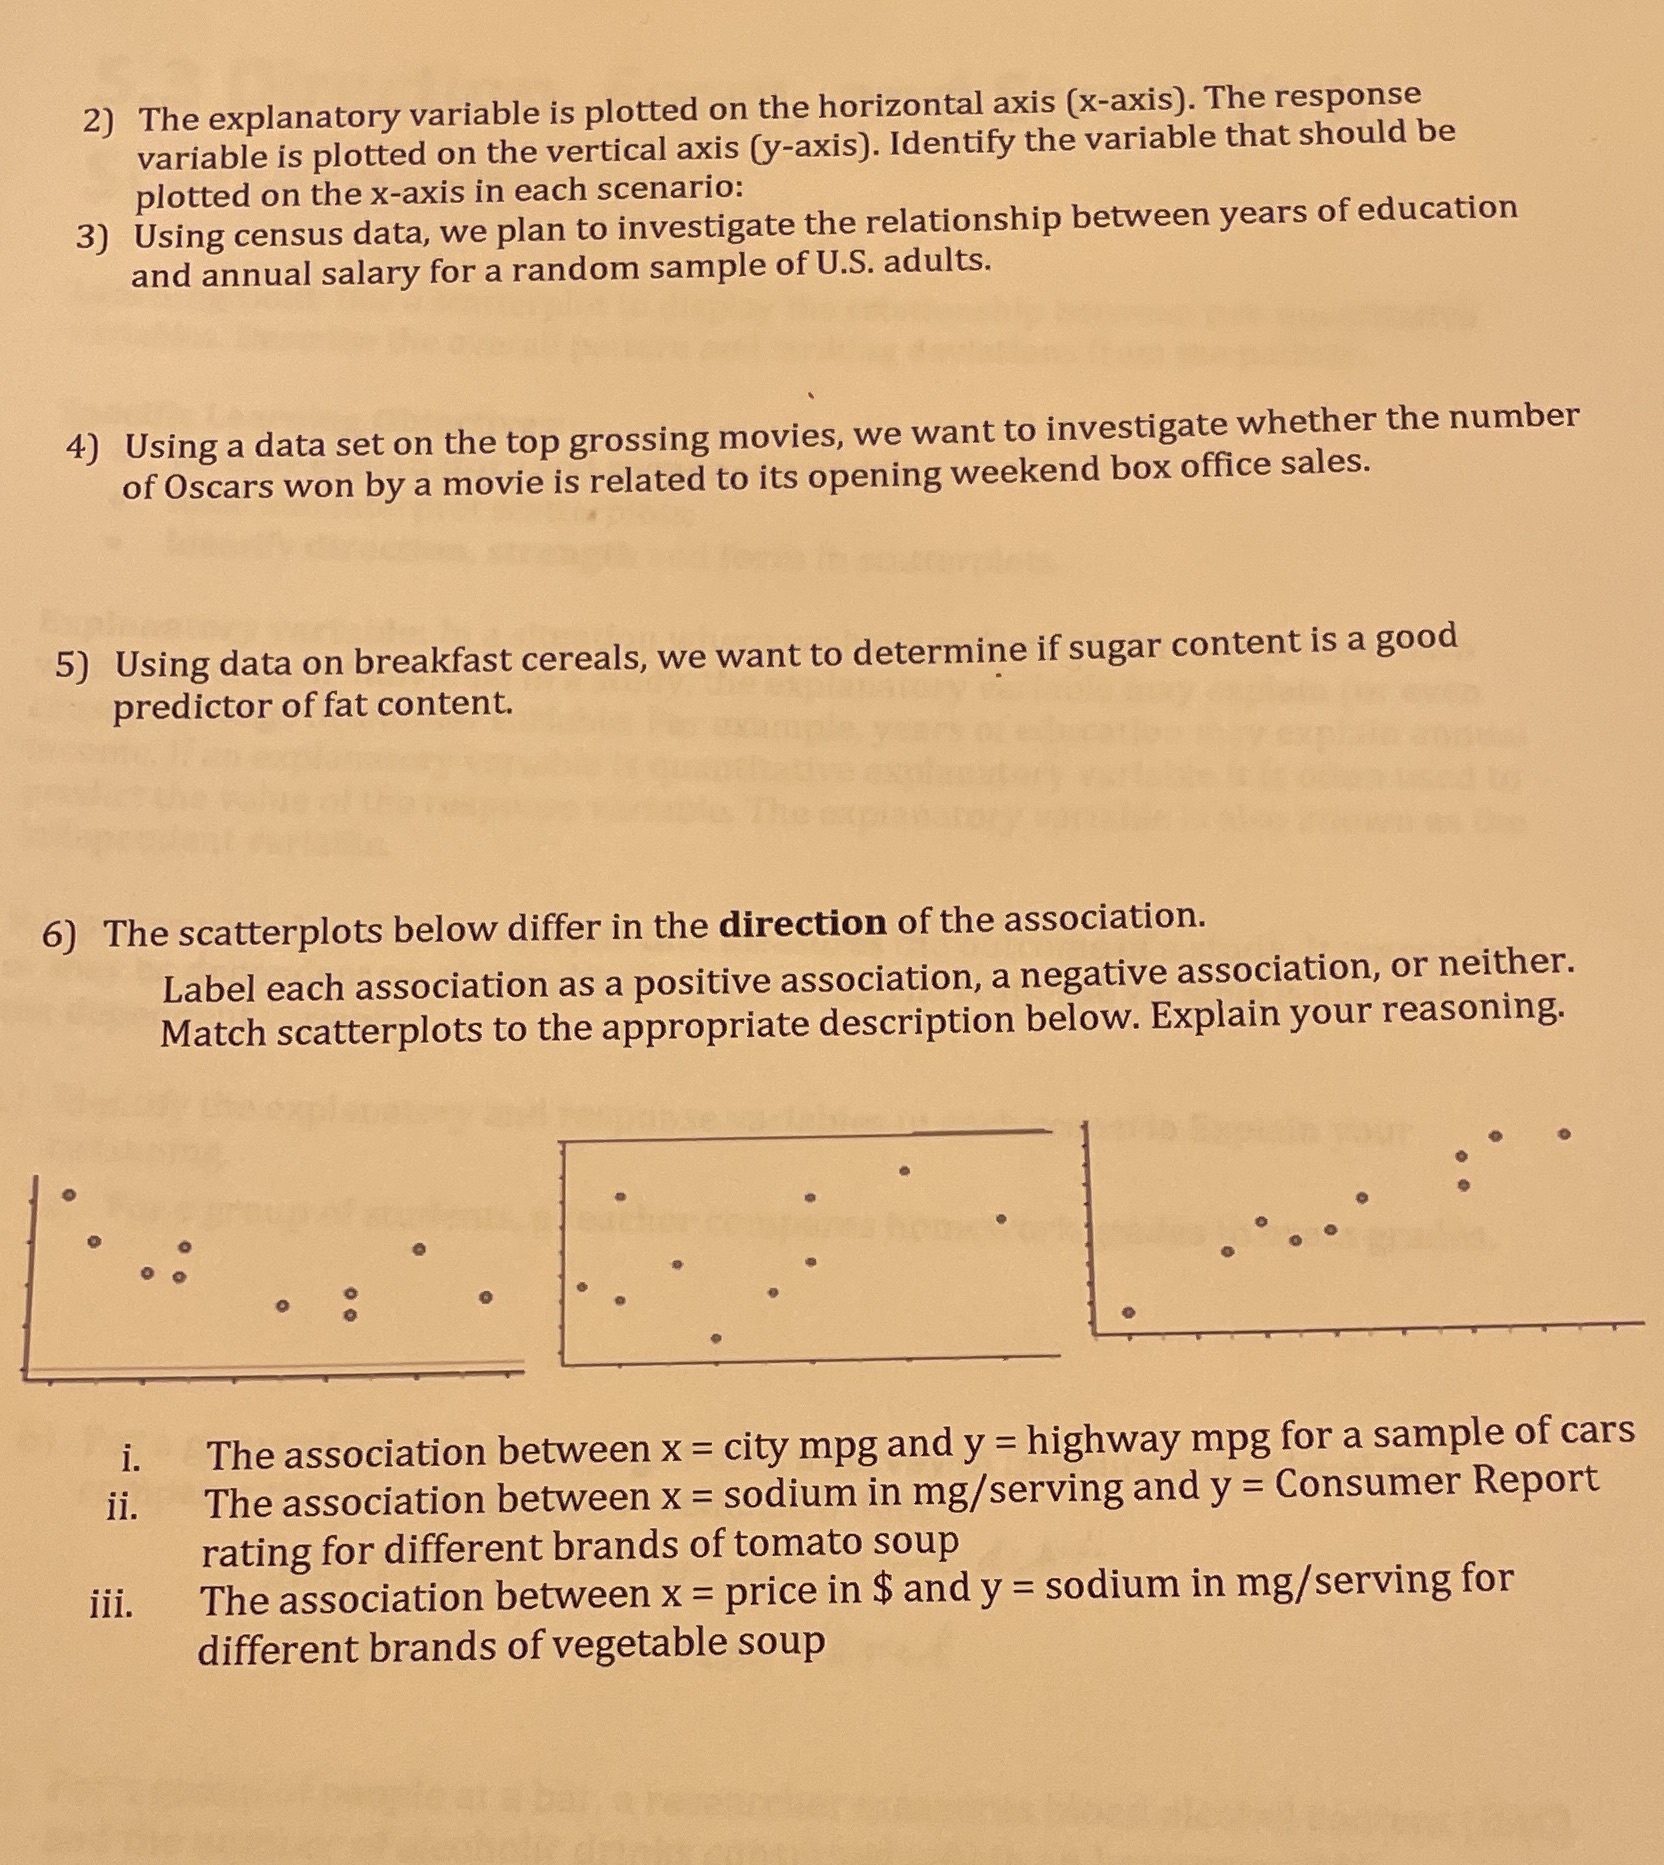
2) The explanatory variable is plotted on the horizontal axis (x-axis). The response variable is plotted on the vertical axis (y-axis). Identify the variable that should be plotted on the x-axis in each scenario: 3) Using census data, we plan to investigate the relationship between years of education and annual salary for a random sample of U.S. adults. 4) Using a data set on the top grossing movies, we want to investigate whether the number of Oscars won by a movie is related to its opening weekend box office sales. 5) Using data on breakfast cereals, we want to determine if sugar content is a good predictor of fat content. 6) The scatterplots below differ in the direction of the association. Label each association as a positive association, a negative association, or neither. Match scatterplots to the appropriate description below. Explain your reasoning. i. The association between x = city mpg and y = highway mpg for a sample of cars ii. The association between x = sodium in mg/serving and y = Consumer Report rating for different brands of tomato soup iii. The association between x = price in $ and y = sodium in mg/serving for different brands of vegetable soup
Step by Step Solution
There are 3 Steps involved in it

Get step-by-step solutions from verified subject matter experts