

Question: 2. The figure below shows the one-year return distribution for RCS stock 35 30 25 20 15 a 10 5 -25% -10% 0% 10% 25%
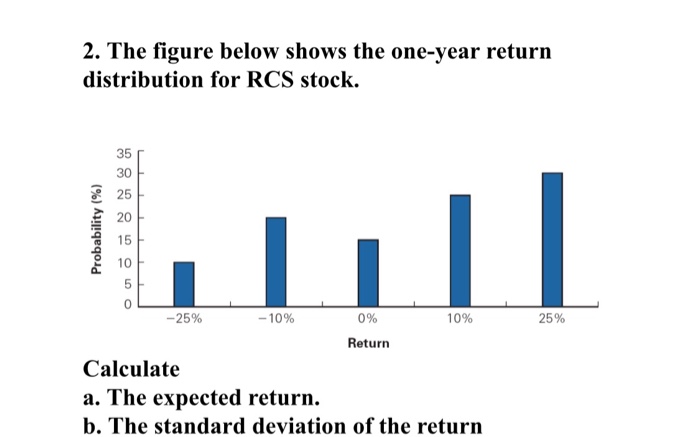
2. The figure below shows the one-year return distribution for RCS stock 35 30 25 20 15 a 10 5 -25% -10% 0% 10% 25% Return Calculate a. The expected return b. The standard deviation of the return
Step by Step Solution
There are 3 Steps involved in it
1 Expert Approved Answer
Step: 1 Unlock

Question Has Been Solved by an Expert!
Get step-by-step solutions from verified subject matter experts
Step: 2 Unlock
Step: 3 Unlock