

Question: 2. The figure plots the expected returns and standard deviation for three assets (A, B and C) Expected return B A Standard deviation a) Consider
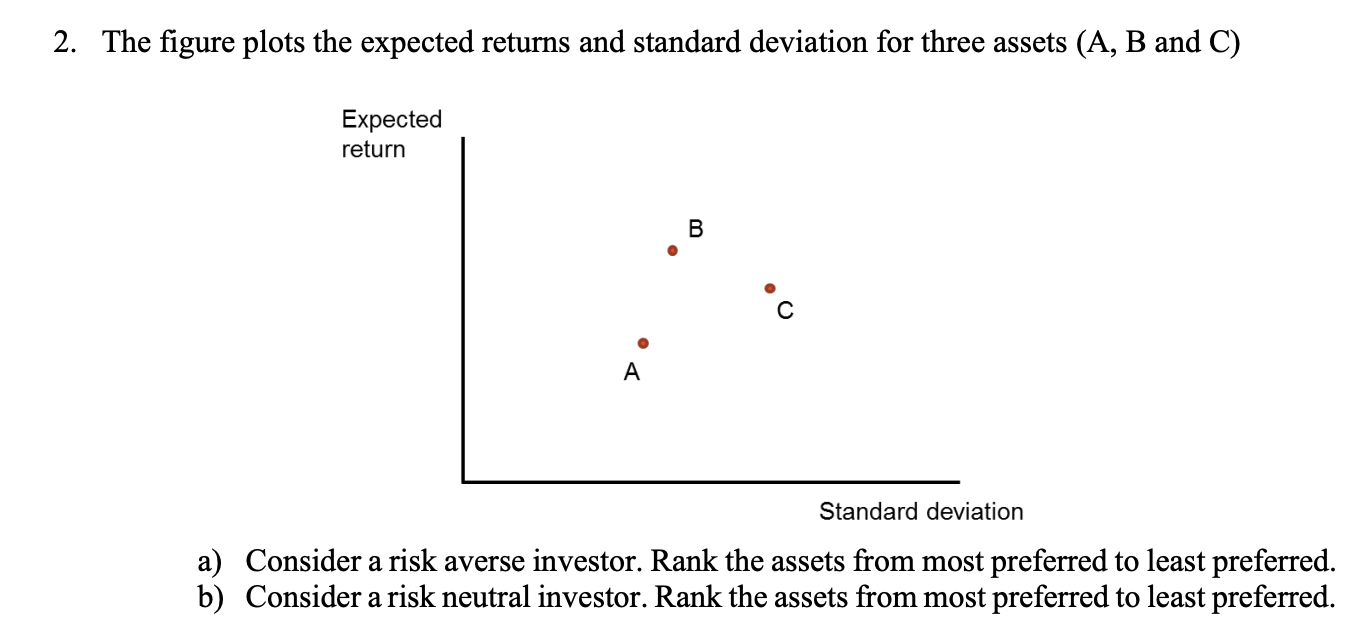
2. The figure plots the expected returns and standard deviation for three assets (A, B and C) Expected return B A Standard deviation a) Consider a risk averse investor. Rank the assets from most preferred to least preferred. b) Consider a risk neutral investor. Rank the assets from most preferred to least preferred
Step by Step Solution
There are 3 Steps involved in it
1 Expert Approved Answer
Step: 1 Unlock

Question Has Been Solved by an Expert!
Get step-by-step solutions from verified subject matter experts
Step: 2 Unlock
Step: 3 Unlock