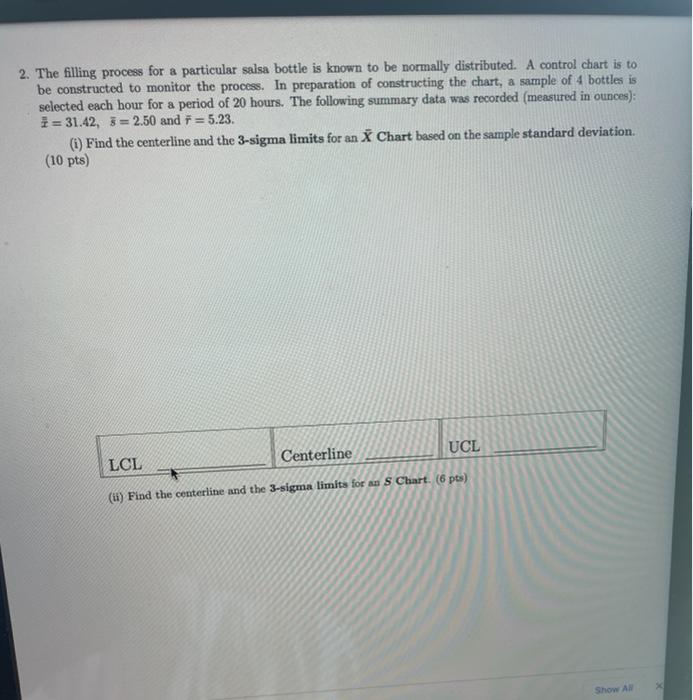
Question: 2. The filling process for a particular salsa bottle is known to be normally distributed. A control chart is to be constructed to monitor the

2. The filling process for a particular salsa
2. The filling process for a particular salsa bottle is known to be normally distributed. A control chart is to be constructed to monitor the process. In preparation of constructing the chart, a sample of 4 bottles is selected each hour for a period of 20 hours. The following summary data was recorded (measured in ounces): 1 = 31.42, 5 = 2.50 and F = 5.23. (1) Find the centerline and the 3-sigma limits for an X Chart based on the sample standard deviation. (10 pts) UCL Centerline LCL (u) Find the centerline and the 3-sigma limits for a S Chart. (6 pts) Show All 2. The filling process for a particular salsa bottle is known to be normally distributed. A control chart is to be constructed to monitor the process. In preparation of constructing the chart, a sample of 4 bottles is selected each hour for a period of 20 hours. The following summary data was recorded (measured in ounces): 1 = 31.42, 5 = 2.50 and F = 5.23. (1) Find the centerline and the 3-sigma limits for an X Chart based on the sample standard deviation. (10 pts) UCL Centerline LCL (u) Find the centerline and the 3-sigma limits for a S Chart. (6 pts) Show All

Step by Step Solution

There are 3 Steps involved in it

1 Expert Approved Answer
Step: 1 Unlock blur-text-image
Question Has Been Solved by an Expert!

Get step-by-step solutions from verified subject matter experts

Step: 2 Unlock
Step: 3 Unlock

Students Have Also Explored These Related General Management Questions!