

Question: 2. The following data represent samples that were taken on 10 separate days. Each day has a varying sample size and the number of defects
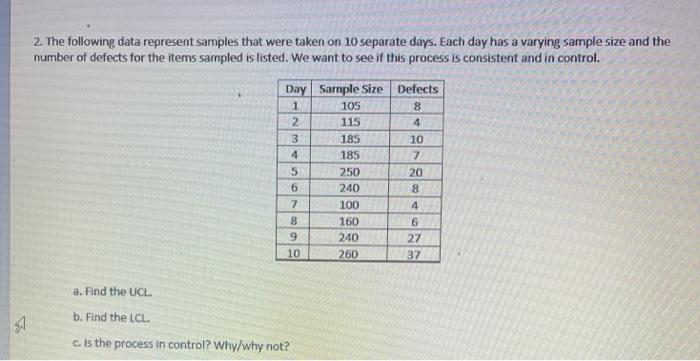
2. The following data represent samples that were taken on 10 separate days. Each day has a varying sample size and the number of defects for the items sampled is listed. We want to see if this process is consistent and in control. Defects 8 4 10 7 100/- Day Sample Size 1 105 2 115 3 185 4 185 5 250 6 240 7 100 8 160 9 240 10 260 20 8 4 6 27 37 a. Find the UCL b. Find the LCL C. Is the process in control? Why/why not
Step by Step Solution
There are 3 Steps involved in it
1 Expert Approved Answer
Step: 1 Unlock

Question Has Been Solved by an Expert!
Get step-by-step solutions from verified subject matter experts
Step: 2 Unlock
Step: 3 Unlock