

Question: 2) The following figure presents values from a source population and estimates from an associated study population. The source parameter is marked with a dot
2)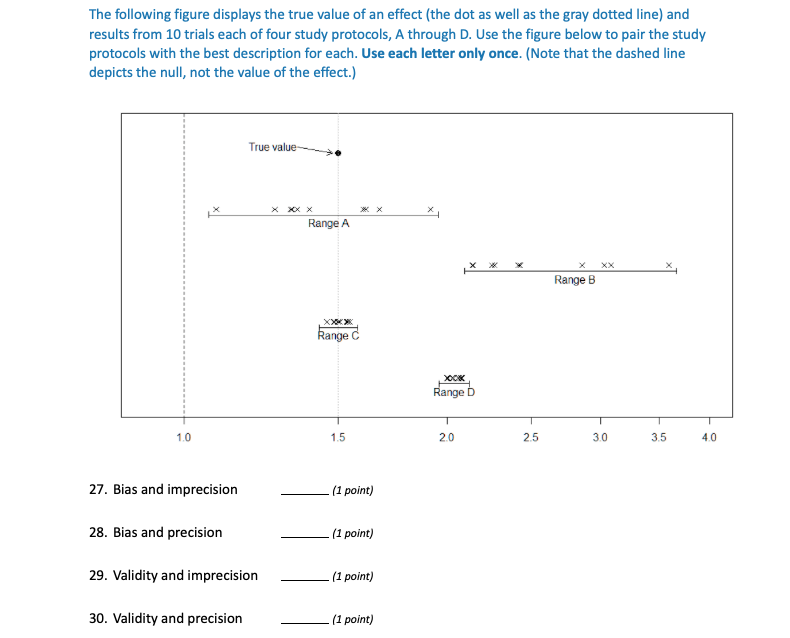
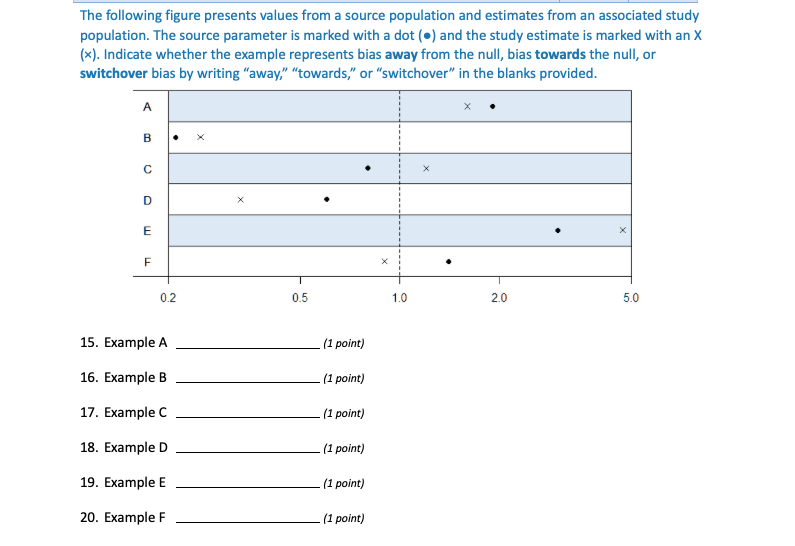
The following figure presents values from a source population and estimates from an associated study population. The source parameter is marked with a dot (.) and the study estimate is marked with an X (*). Indicate whether the example represents bias away from the null, bias towards the null, or switchover bias by writing "away," "towards," or "switchover" in the blanks provided. A B D E x TI F X T 0.2 0.5 1.0 2.0 5.0 15. Example A (1 point) 16. Example B (1 point) 17. Example C (1 point) 18. Example D (1 point) 19. Example E (1 point) 20. Example F (1 point) The following figure displays the true value of an effect (the dot as well as the gray dotted line) and results from 10 trials each of four study protocols, A through D. Use the figure below to pair the study protocols with the best description for each. Use each letter only once. (Note that the dashed line depicts the null, not the value of the effect.) True value X XXX Range A XX Range B kange XOCK Range D T T T 1.0 1.5 20 25 3.0 3.5 40 27. Bias and imprecision (1 point) 28. Bias and precision (1 point) 29. Validity and imprecision (1 point) 30. Validity and precision (1 point) The following figure presents values from a source population and estimates from an associated study population. The source parameter is marked with a dot (.) and the study estimate is marked with an X (*). Indicate whether the example represents bias away from the null, bias towards the null, or switchover bias by writing "away," "towards," or "switchover" in the blanks provided. A B D E x TI F X T 0.2 0.5 1.0 2.0 5.0 15. Example A (1 point) 16. Example B (1 point) 17. Example C (1 point) 18. Example D (1 point) 19. Example E (1 point) 20. Example F (1 point) The following figure displays the true value of an effect (the dot as well as the gray dotted line) and results from 10 trials each of four study protocols, A through D. Use the figure below to pair the study protocols with the best description for each. Use each letter only once. (Note that the dashed line depicts the null, not the value of the effect.) True value X XXX Range A XX Range B kange XOCK Range D T T T 1.0 1.5 20 25 3.0 3.5 40 27. Bias and imprecision (1 point) 28. Bias and precision (1 point) 29. Validity and imprecision (1 point) 30. Validity and precision (1 point)
Step by Step Solution
There are 3 Steps involved in it

Get step-by-step solutions from verified subject matter experts