

Question: 2 . The following table presents data collected in the last household O - D survey ( made ten years ago ) for three particular
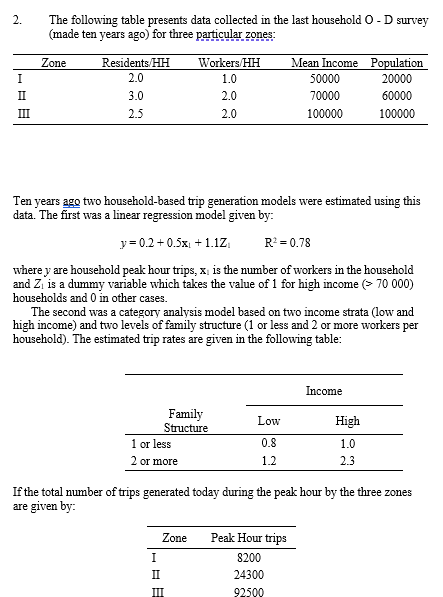
The following table presents data collected in the last household O D survey made ten years ago for three particular zones:
Ten years ago two householdbased trip generation models were estimated using this data. The first was a linear regression model given by:
ymathrmxmathrmZquad mathrmR
where y are household peak hour trips, mathrmx is the number of workers in the household and Z is a dummy variable which takes the value of for high income households and in other cases.
The second was a category analysis model based on two income strata low and high income and two levels of family structure or less and or more workers per household The estimated trip rates are given in the following table:
If the total number of trips generated today during the peak hour by the three zones are given by:
Step by Step Solution
There are 3 Steps involved in it
1 Expert Approved Answer
Step: 1 Unlock

Question Has Been Solved by an Expert!
Get step-by-step solutions from verified subject matter experts
Step: 2 Unlock
Step: 3 Unlock