

Question: 2.) The following table summarizes data on smoking status and age group, and is consistent with summary quantities 2 obtained in a Gallup Poll published
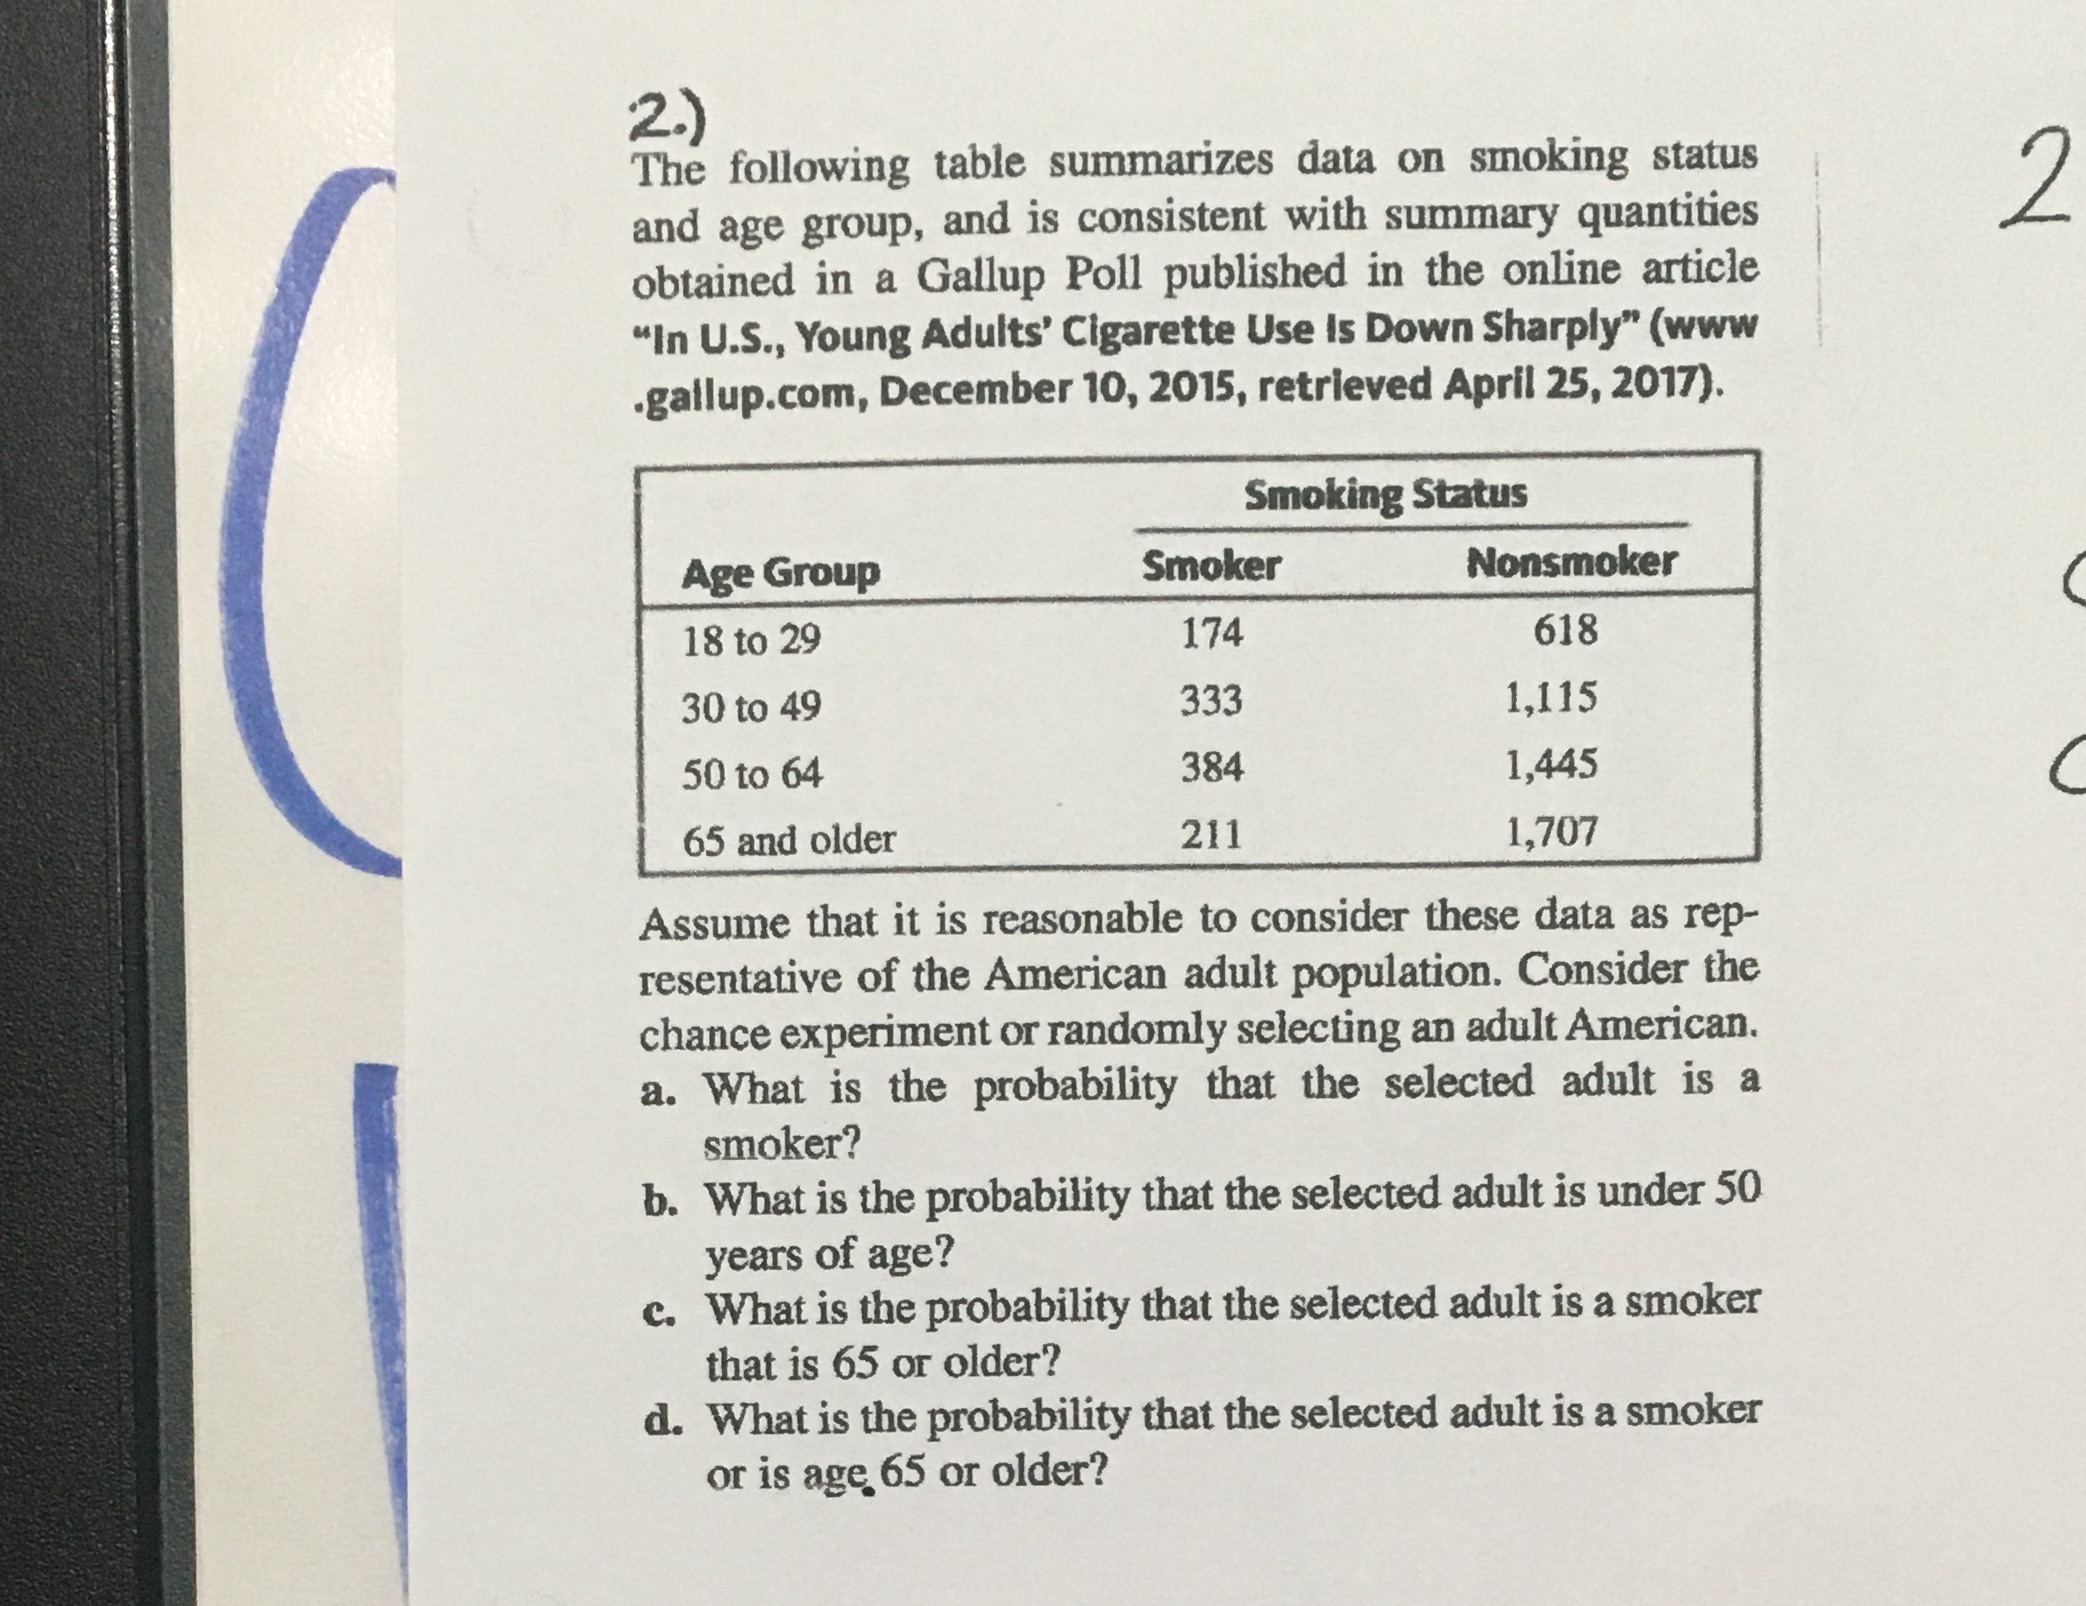
2.) The following table summarizes data on smoking status and age group, and is consistent with summary quantities 2 obtained in a Gallup Poll published in the online article "In U.S., Young Adults' Cigarette Use Is Down Sharply" (www .gallup.com, December 10, 2015, retrieved April 25, 2017). Smoking Status Age Group Smoker Nonsmoker 18 to 29 174 618 30 to 49 333 1,115 50 to 64 384 1,445 65 and older 211 1,707 Assume that it is reasonable to consider these data as rep- resentative of the American adult population. Consider the chance experiment or randomly selecting an adult American. a. What is the probability that the selected adult is a smoker? b. What is the probability that the selected adult is under 50 years of age? c. What is the probability that the selected adult is a smoker that is 65 or older? d. What is the probability that the selected adult is a smoker or is age 65 or older
Step by Step Solution
There are 3 Steps involved in it

Get step-by-step solutions from verified subject matter experts