

Question: 2. The graph below shows a consumption function. 6000 5000 45-degree line 4000 3000 2000 1000 Consumption 0 1000 2000 3000 4000 5000 6000 Disposable
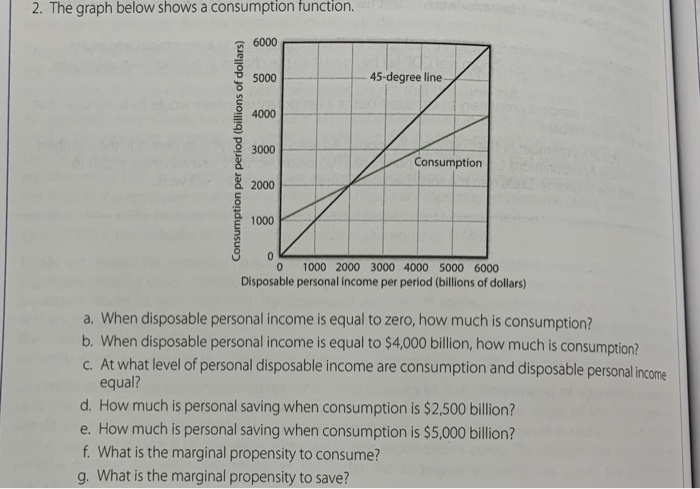
2. The graph below shows a consumption function. 6000 5000 45-degree line 4000 3000 2000 1000 Consumption 0 1000 2000 3000 4000 5000 6000 Disposable personal income per period (billions of dollars) a. When disposable personal income is equal to zero, how much is consumption? b. When disposable personal income is equal to $4,000 billion, how much is consumption? c. At what level of personal disposable income are consumption and disposable personal incom equal? d. How much is personal saving when consumption is $2,500 billion? e. How much is personal saving when consumption is $5,000 billion? f. What is the marginal propensity to consume? g. What is the marginal propensity to save? 3
Step by Step Solution
There are 3 Steps involved in it

Get step-by-step solutions from verified subject matter experts