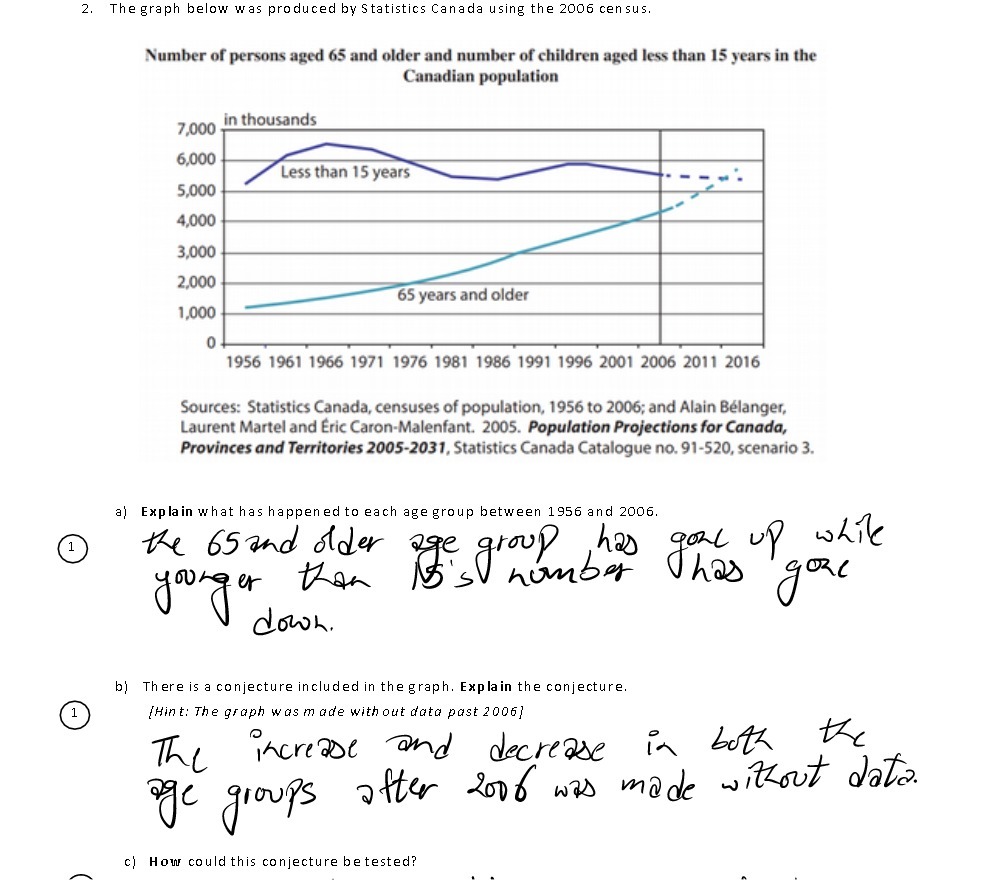
Question: 2. The graph below was produced by Statistics Canada using the 2006 census. Number of persons aged 65 and older and number of children aged

2. The graph below was produced by Statistics
2. The graph below was produced by Statistics Canada using the 2006 census. Number of persons aged 65 and older and number of children aged less than 15 years in the Canadian population 7,000 in thousands 6,000 Less than 15 years 5,000 4,000 3,000 2,000 65 years and older 1,000 1956 1961 1966 1971 1976 1981 1986 1991 1996 2001 2006 2011 2016 Sources: Statistics Canada, censuses of population, 1956 to 2006; and Alain Belanger, Laurent Martel and Eric Caron-Malenfant. 2005. Population Projections for Canada, Provinces and Territories 2005-2031, Statistics Canada Catalogue no. 91-520, scenario 3. a) Explain what has happened to each age group between 1956 and 2006. 1 the 65 and older age group ,has gone up while younger than 15's number has gone down. b) There is a conjecture included in the graph. Explain the conjecture. 1 (Hint: The graph was made with out doto post 2006] The increase and decrease in both the age groups after 20ob was made without data . c) How could this conjecture be tested

Step by Step Solution

There are 3 Steps involved in it

1 Expert Approved Answer
Step: 1 Unlock blur-text-image
Question Has Been Solved by an Expert!

Get step-by-step solutions from verified subject matter experts

Step: 2 Unlock
Step: 3 Unlock

Students Have Also Explored These Related Mathematics Questions!