

Question: 2. The graph for this problem is shown on the next page. Suppose a consumer has income of $200. The price of good X is

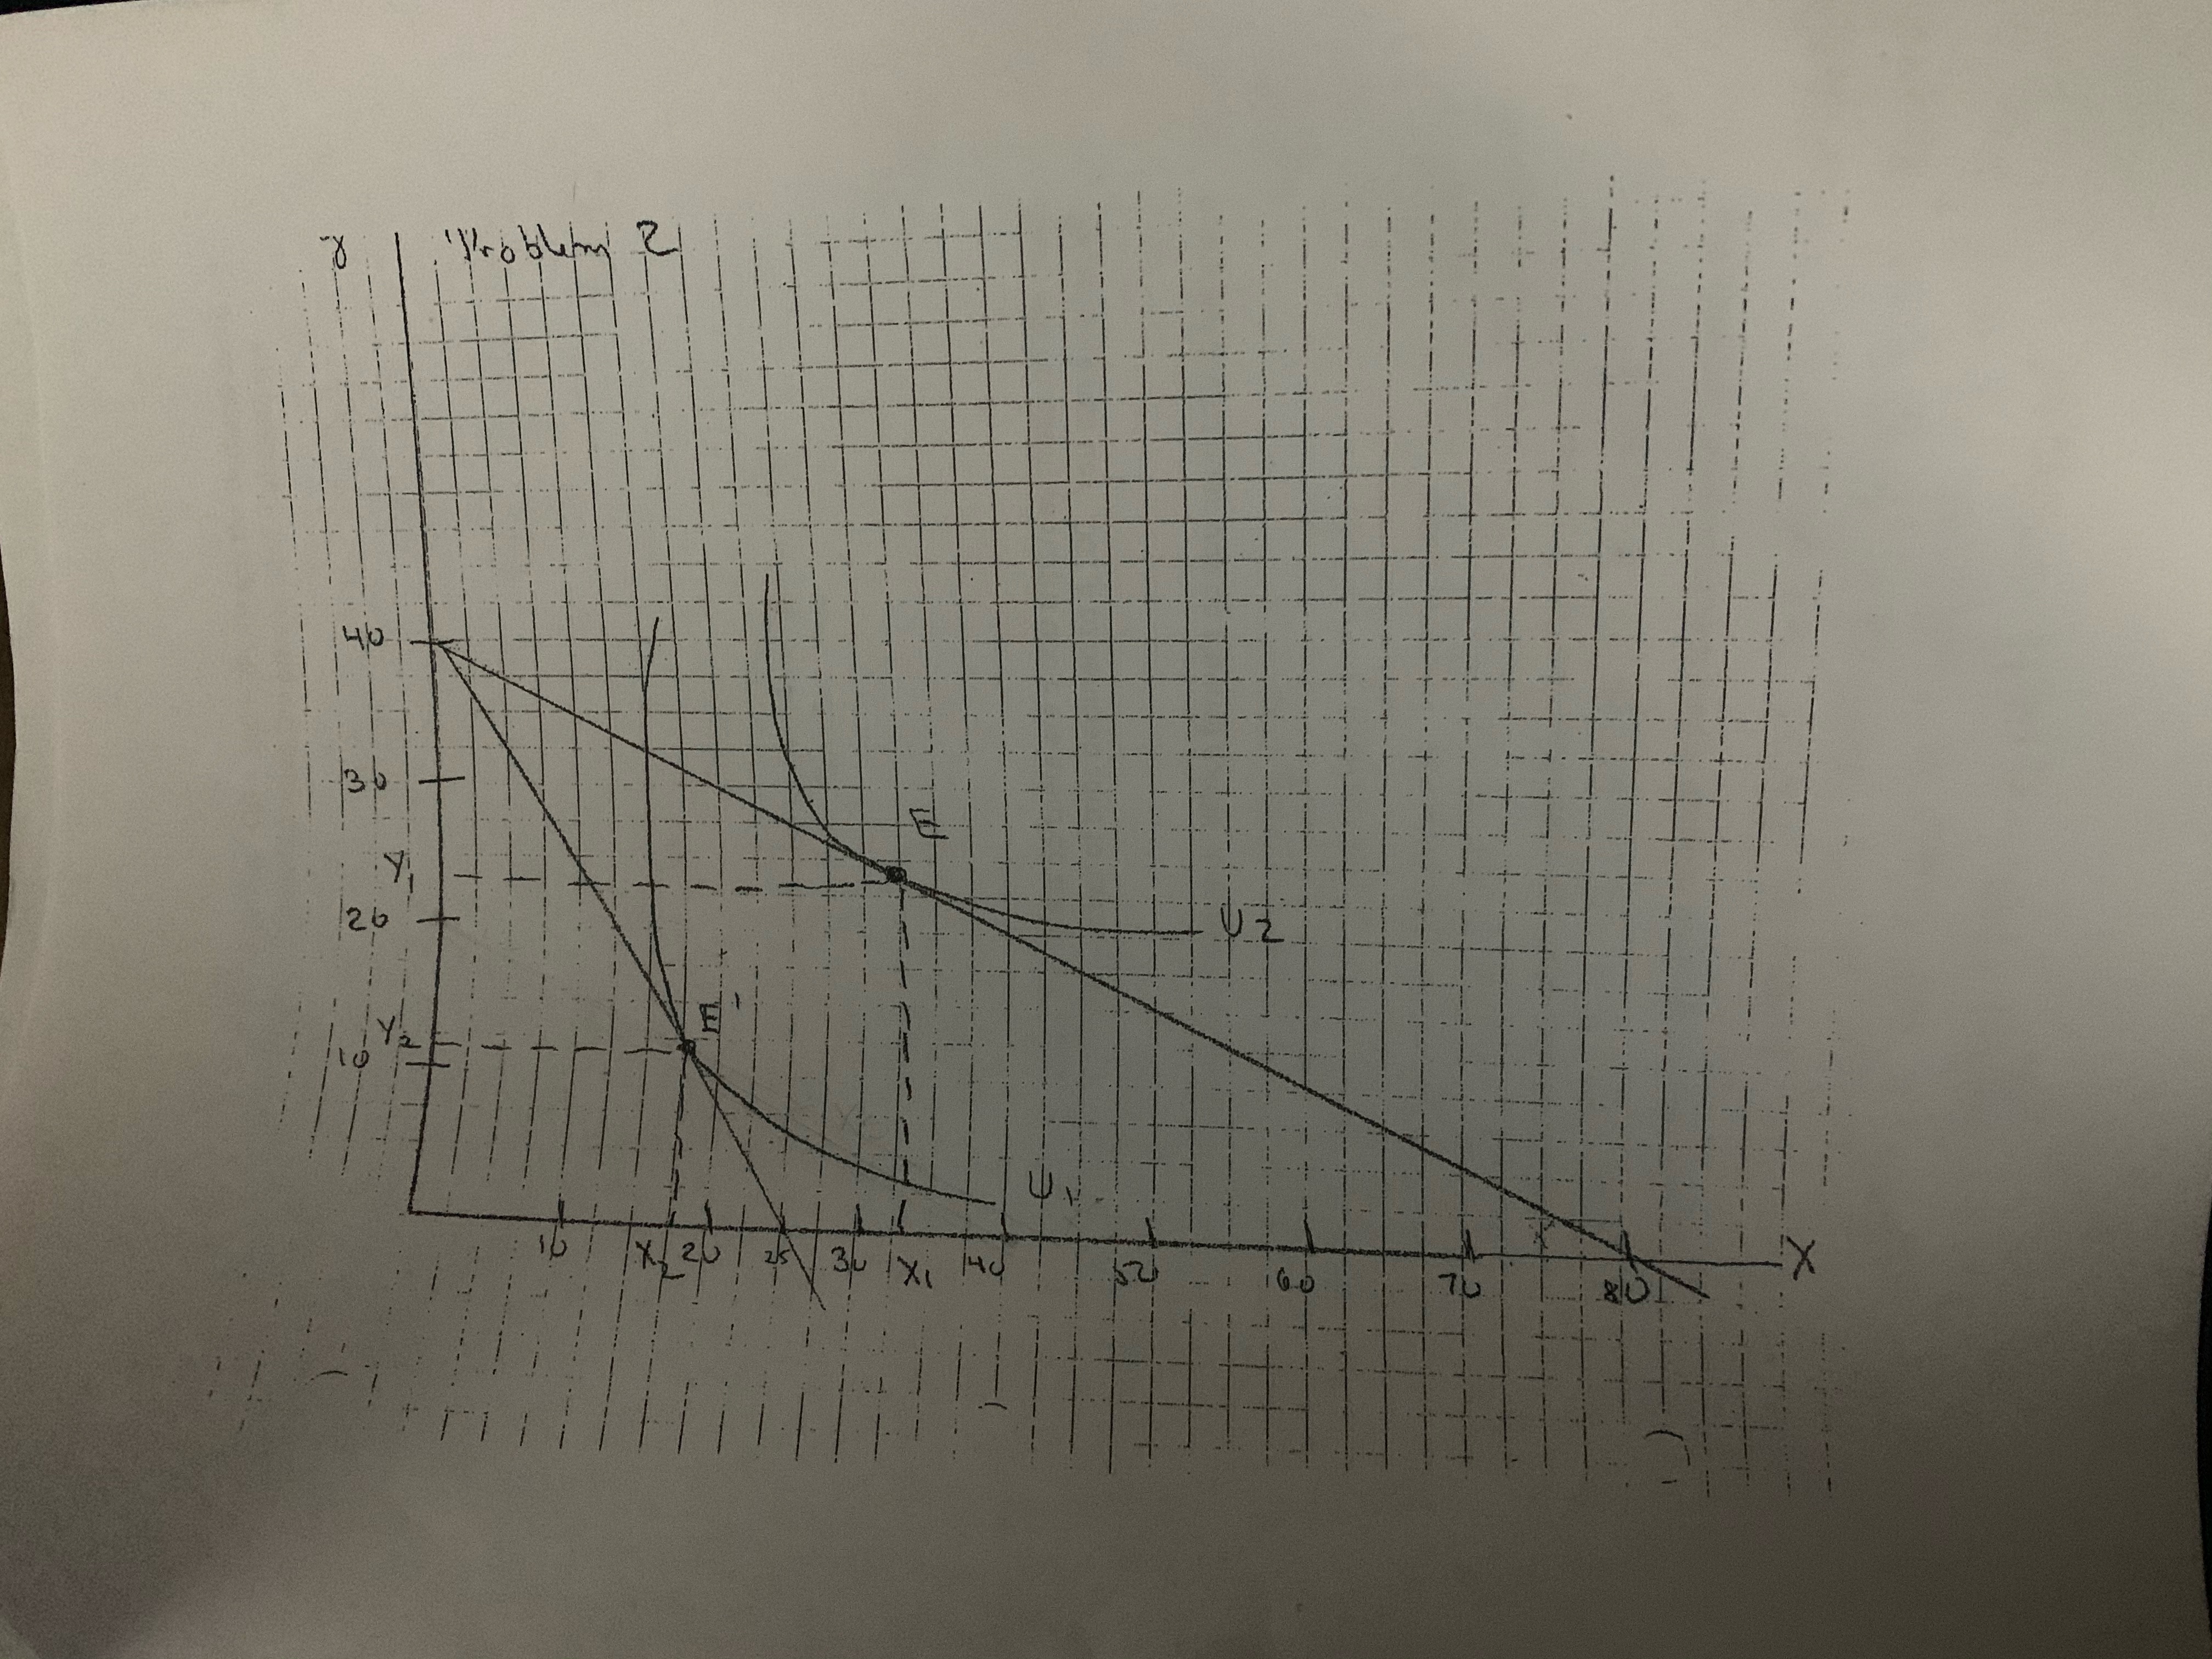
2. The graph for this problem is shown on the next page. Suppose a consumer has income of $200. The price of good X is initially PX =$2.50 and the price of good Y is initially Py = $5. The budget constraint connects the badly cts the points (0,40) and (80,0). The consumer maximizes utility at point E consuming X1 and Y1. When the price of good X increases to Px' = $8 the budget constraint rotates in along the horizontal axis and the new horizontal intercept is (25, 0). The new point of utility maximization nization is E' where the consumer consumes X2 and Yz. a. What is the MRSxy at point E? At point E'? MRSXYZ MRSxy = 2030 - 7 ut point e 8 = 16 at pointer b. Graphically show the substitution effect by drawing a line parallel to the new budget constraint but tangent to the original indifference curve (U2). Label the quantity of X at this point of tangency Xs. How much did X decrease by due to the substitution effect? c. By how much did X decrease by due to the income effect? d. Is X a normal or inferior good? EXPLAIN.
Step by Step Solution
There are 3 Steps involved in it

Get step-by-step solutions from verified subject matter experts