

Question: 2. The histogram below shows the efficiency level (in miles per gallons) of 110 cars. 40 35 30 25 20 Frequency 10 un 0 10
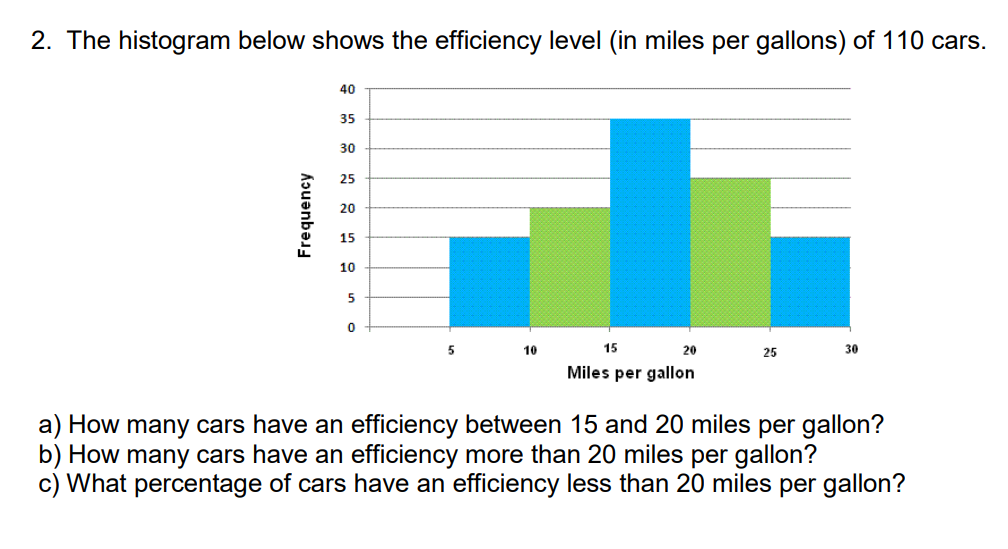

2. The histogram below shows the efficiency level (in miles per gallons) of 110 cars. 40 35 30 25 20 Frequency 10 un 0 10 15 20 25 30 Miles per gallon a) How many cars have an efficiency between 15 and 20 miles per gallon? b) How many cars have an efficiency more than 20 miles per gallon? c) What percentage of cars have an efficiency less than 20 miles per gallon
Step by Step Solution
There are 3 Steps involved in it
1 Expert Approved Answer
Step: 1 Unlock

Question Has Been Solved by an Expert!
Get step-by-step solutions from verified subject matter experts
Step: 2 Unlock
Step: 3 Unlock