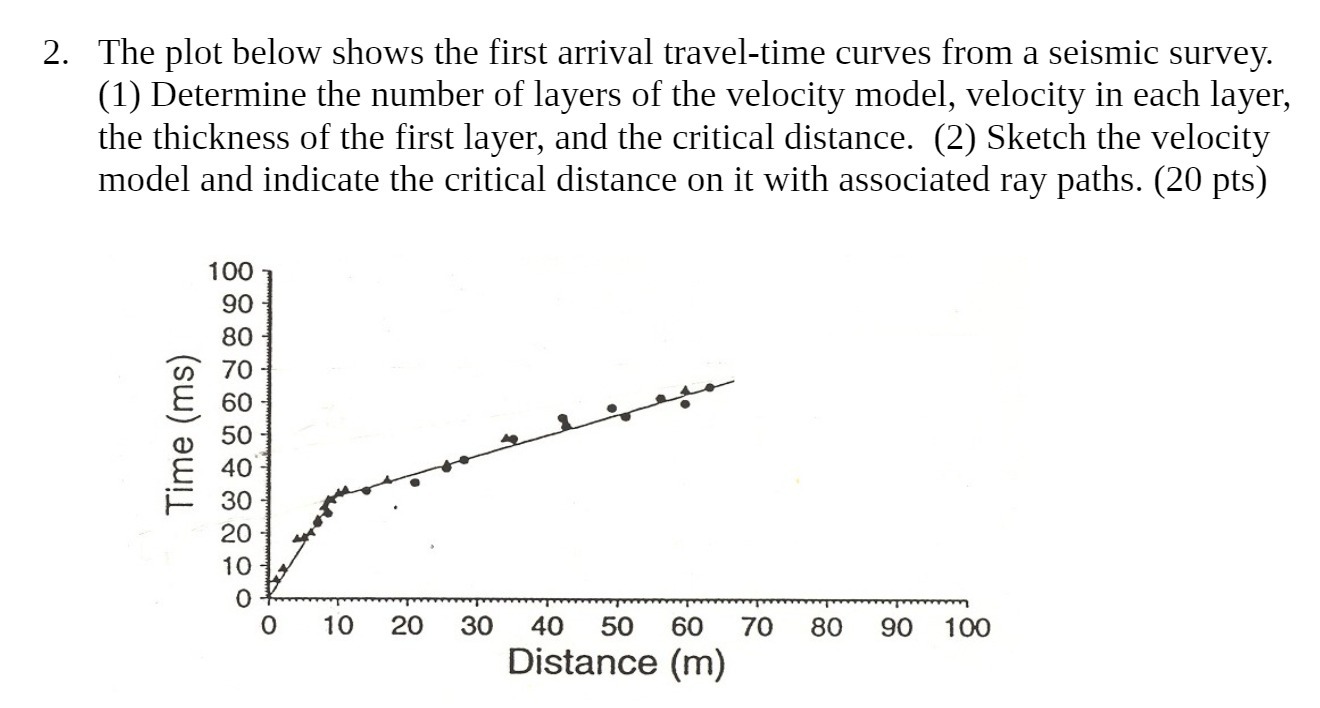
Question: 2. The plot below shows the first arrival travel-time curves from a seismic survey. (1) Determine the number of layers of the velocity model, velocity

2. The plot below shows the first arrival
2. The plot below shows the first arrival travel-time curves from a seismic survey. (1) Determine the number of layers of the velocity model, velocity in each layer, the thickness of the first layer, and the critical distance. (2) Sketch the velocity model and indicate the critical distance on it with associated ray paths. (20 pts) 100 90 80 7O 60 50 40' 30 20 10 0 Time (ms) 0102030405060708090100 Distance (m)

Step by Step Solution

There are 3 Steps involved in it

1 Expert Approved Answer
Step: 1 Unlock blur-text-image
Question Has Been Solved by an Expert!

Get step-by-step solutions from verified subject matter experts

Step: 2 Unlock
Step: 3 Unlock

Students Have Also Explored These Related Mathematics Questions!