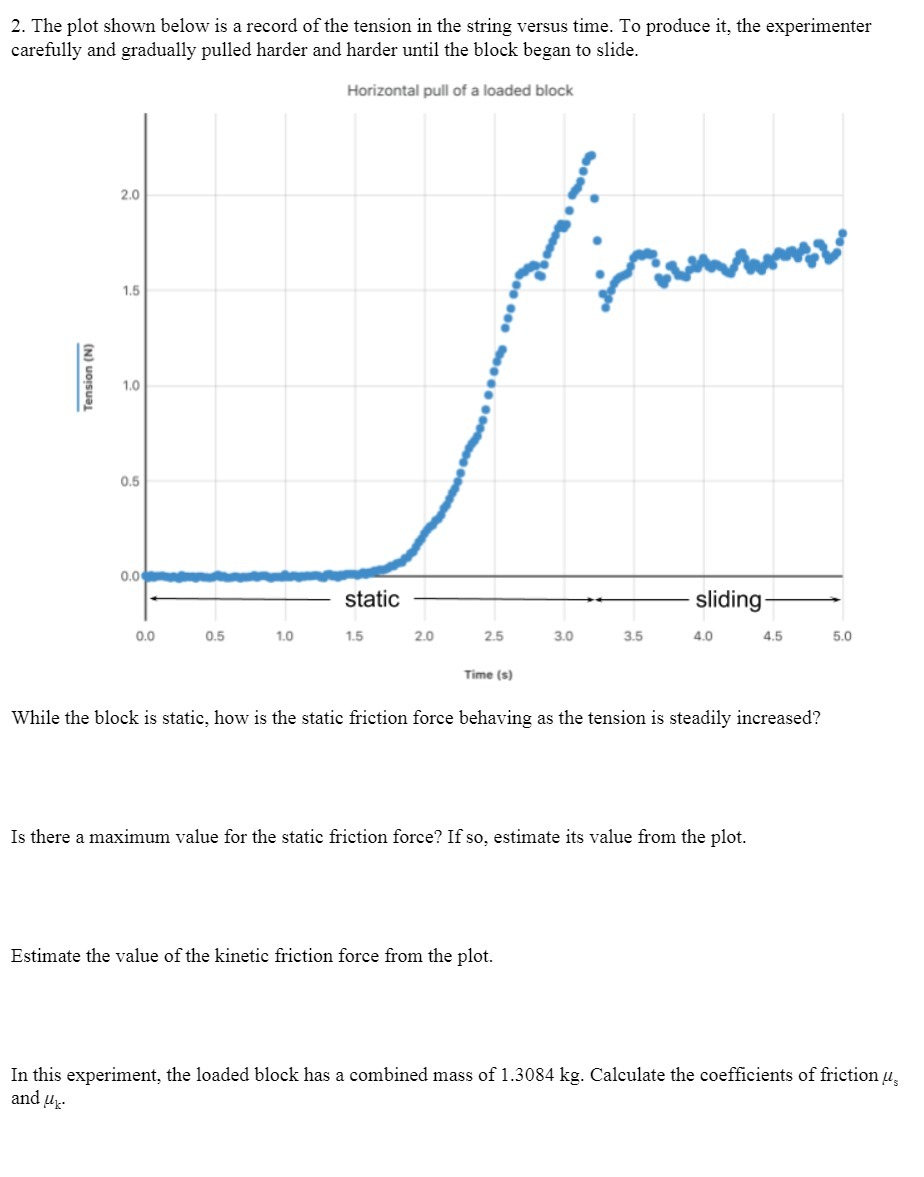
Question: 2. The plot shown below is a record of the tension in the string versus time. To produce it, the experimenter carefully and gradually pulled

2. The plot shown below is a record of the
2. The plot shown below is a record of the tension in the string versus time. To produce it, the experimenter carefully and gradually pulled harder and harder until the block began to slide. Horizontal pull of a loaded block 2.0 w 1.5 Tension (N) 1.0 0.5 0.0 static sliding 0.0 0.5 1.0 1.5 2.0 2.5 3.0 3.5 4.0 4.5 5.0 Time (s) While the block is static, how is the static friction force behaving as the tension is steadily increased? Is there a maximum value for the static friction force? If so, estimate its value from the plot. Estimate the value of the kinetic friction force from the plot. In this experiment, the loaded block has a combined mass of 1.3084 kg. Calculate the coefficients of friction , and uk

Step by Step Solution

There are 3 Steps involved in it

1 Expert Approved Answer
Step: 1 Unlock blur-text-image
Question Has Been Solved by an Expert!

Get step-by-step solutions from verified subject matter experts

Step: 2 Unlock
Step: 3 Unlock

Students Have Also Explored These Related Mathematics Questions!