

Question: 2. The sampling distribution below shows sample means from samples of size n = 50. a) What does one dot on the sampling distribution represent?
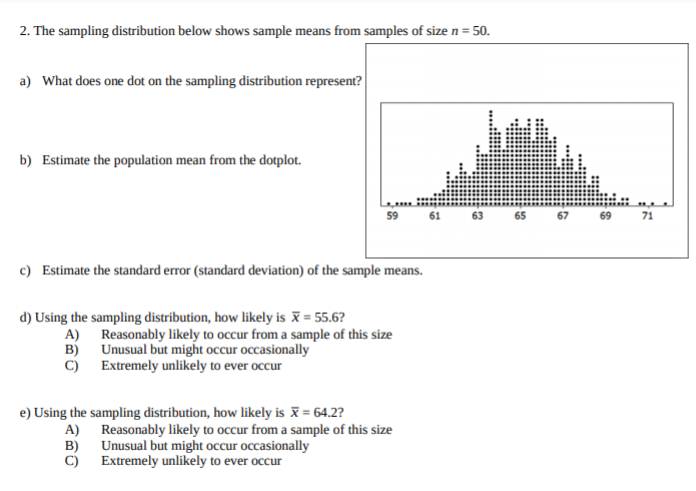
2. The sampling distribution below shows sample means from samples of size n = 50. a) What does one dot on the sampling distribution represent? b) Estimate the population mean from the dotplot. 59 61 63 65 67 69 71 c) Estimate the standard error (standard deviation) of the sample means. d) Using the sampling distribution, how likely is X = 55.6? A) Reasonably likely to occur from a sample of this size B) Unusual but might occur occasionally C) Extremely unlikely to ever occur e) Using the sampling distribution, how likely is X = 64.2? A) Reasonably likely to occur from a sample of this size B) Unusual but might occur occasionally C) Extremely unlikely to ever occur
Step by Step Solution
There are 3 Steps involved in it

Get step-by-step solutions from verified subject matter experts