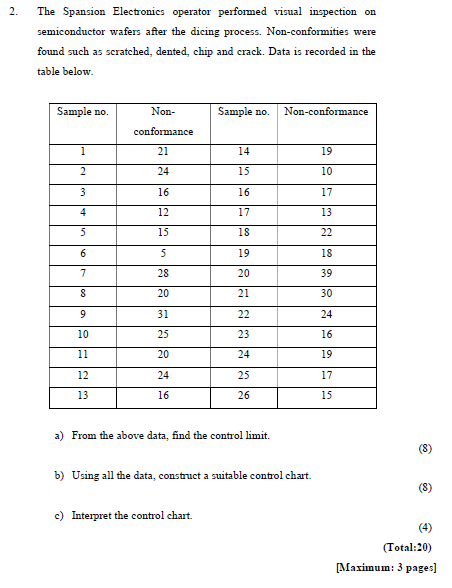
Question: 2. The Spansion Electronics operator performed visual inspection on semiconductor wafers after the dicing process. Non-conformities were found such as scratched, dented, chip and crack.

2. The Spansion Electronics operator performed

2. The Spansion Electronics operator performed visual inspection on semiconductor wafers after the dicing process. Non-conformities were found such as scratched, dented, chip and crack. Data is recorded in the table below Sample no. Non- Sample no. Non-conformance conformance 1 21 14 19 2 24 15 10 3 16 16 17 4 12 17 13 5 15 18 22 6 5 19 18 7 28 20 39 8 20 21 30 9 31 22 24 10 25 23 16 11 20 24 19 12 24 25 17 13 16 26 15 a) From the above data, find the control limit. b) Using all the data, construct a suitable control chart. c) Interpret the control chart. (4) (Total:20) [Maximum: 3 pages]

Step by Step Solution

There are 3 Steps involved in it

1 Expert Approved Answer
Step: 1 Unlock blur-text-image
Question Has Been Solved by an Expert!

Get step-by-step solutions from verified subject matter experts

Step: 2 Unlock
Step: 3 Unlock

Students Have Also Explored These Related General Management Questions!