

Question: 2. The table below shows some data that describes Sam's total product. The numbers tell us how Sam's output of T-shirts changes as Sam employs
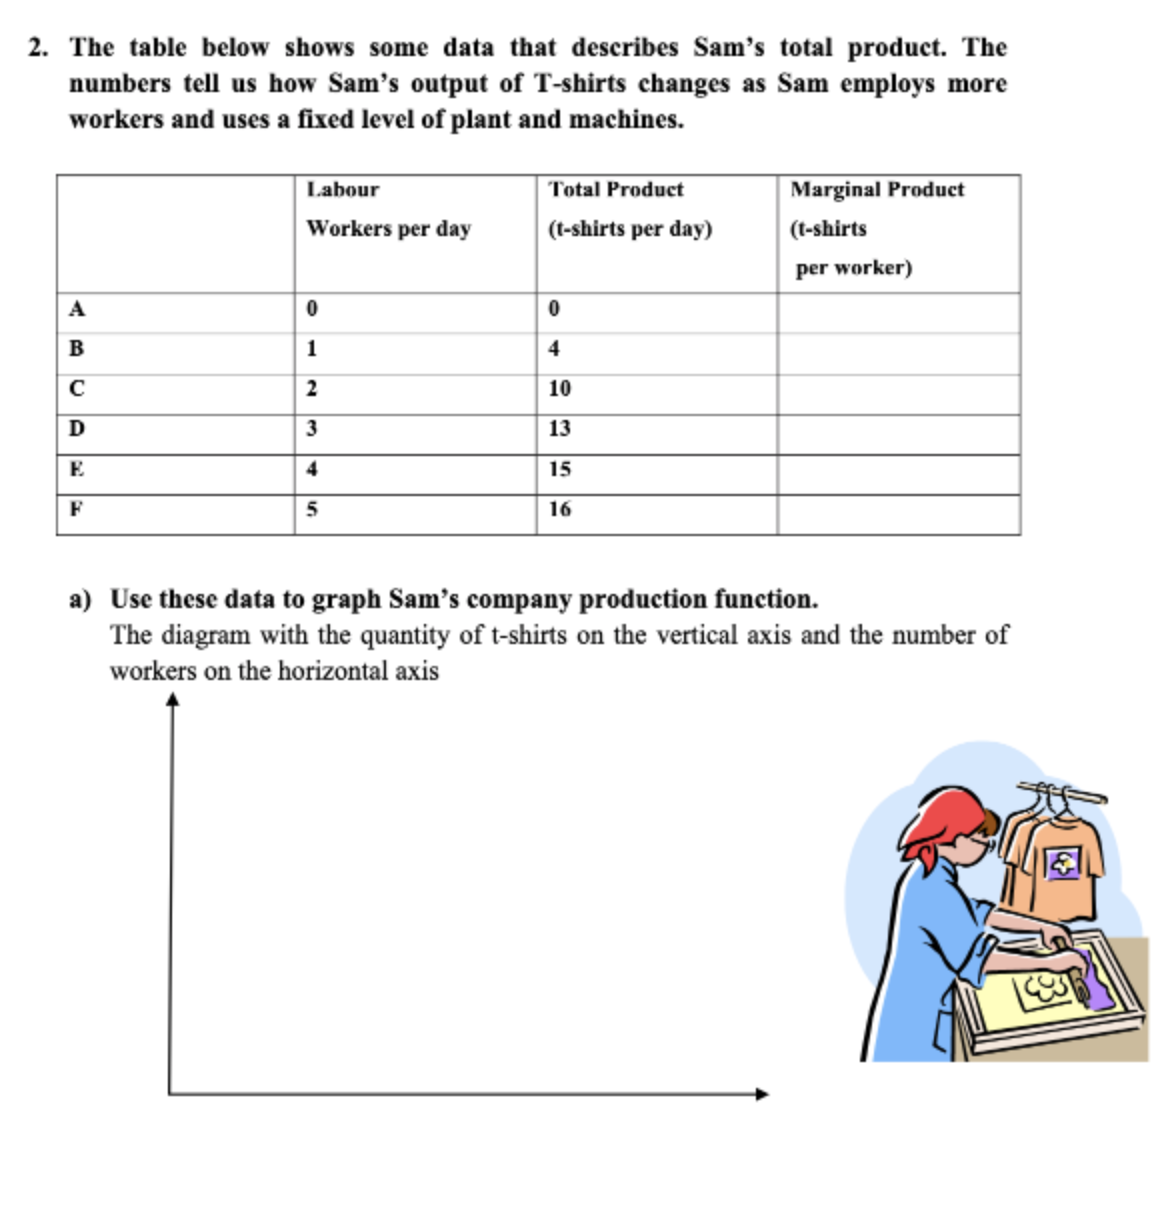
2. The table below shows some data that describes Sam's total product. The numbers tell us how Sam's output of T-shirts changes as Sam employs more workers and uses a fixed level of plant and machines. Labour Total Product Marginal Product Workers per day (t-shirts per day) (t-shirts per worker) 0 4 C 2 10 D 13 15 un 16 a) Use these data to graph Sam's company production function. The diagram with the quantity of t-shirts on the vertical axis and the number of workers on the horizontal axisb) Calculate the marginal product and fill in the last column in the table. Show the MR product on your diagram for part (a). c) Explain why the total-cost curve gets steeper as the amount of production increases. Sam's production function is about the relationship between input/output and input/output (number of workers and number of t-shirts). The production function gets steeper because of d) Why marginal products are diminishing? Show on the diagram the range of the diminishing marginal product
Step by Step Solution
There are 3 Steps involved in it

Get step-by-step solutions from verified subject matter experts