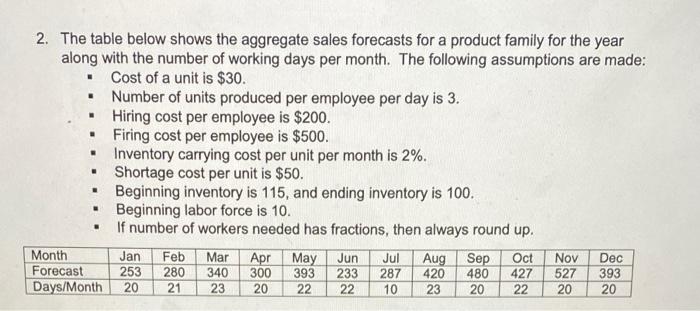
Question: 2. The table below shows the aggregate sales forecasts for a product family for the year along with the number of working days per month.

2. The table below shows the aggregate sales
2. The table below shows the aggregate sales forecasts for a product family for the year along with the number of working days per month. The following assumptions are made: - Cost of a unit is $30. - Number of units produced per employee per day is 3. - Hiring cost per employee is $200. - Firing cost per employee is $500. - Inventory carrying cost per unit per month is 2%. - Shortage cost per unit is $50. - Beginning inventory is 115 , and ending inventory is 100. - Beginning labor force is 10 . - If number of workers needed has fractions, then always round up

Step by Step Solution

There are 3 Steps involved in it

1 Expert Approved Answer
Step: 1 Unlock blur-text-image
Question Has Been Solved by an Expert!

Get step-by-step solutions from verified subject matter experts

Step: 2 Unlock
Step: 3 Unlock

Students Have Also Explored These Related General Management Questions!