

Question: 2.) The two pie charts below show the distribution for the (aggregate) investments in assets for life insurance companies and property and casualty insurance companies
2.) The two pie charts below show the distribution for the (aggregate) investments in assets for life insurance companies and property and casualty insurance companies respectively. Briefly indicate why these two types of insurers (life insurance versus property and casualty insurance) differ in terms of the assets that they hold.
(The picture contains all known information)
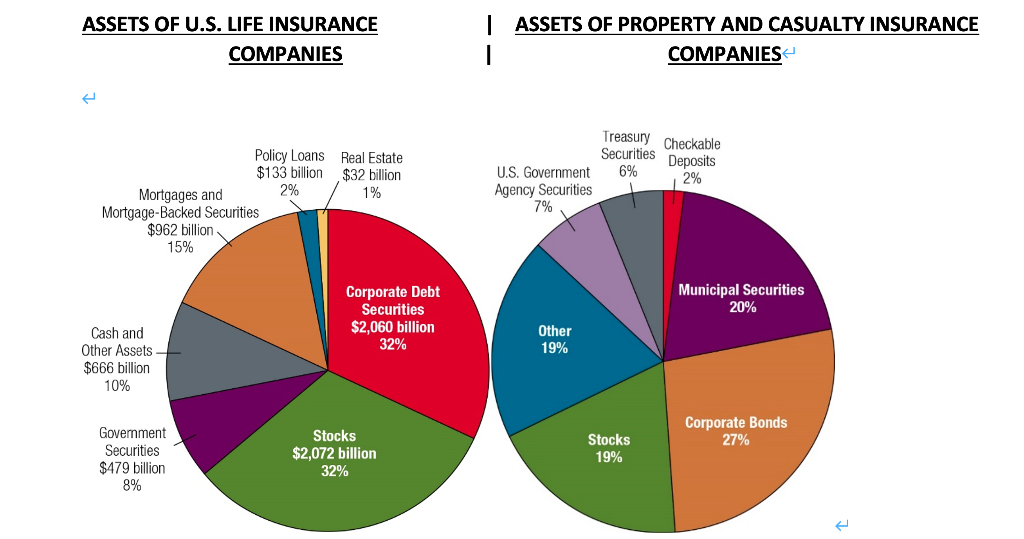
ASSETS OF U.S. LIFE INSURANCE COMPANIES | ASSETS OF PROPERTY AND CASUALTY INSURANCE COMPANIES Treasury Checkable Securities Deposits 6% 2% Policy Loans Real Estate $133 billion $32 billion 2% Mortgages and 1% Mortgage-Backed Securities $962 billion 15% U.S. Government Agency Securities 7% Municipal Securities 20% Corporate Debt Securities $2,060 billion 32% Cash and Other Assets $666 billion Other 19% 10% Corporate Bonds 27% Government Securities $479 billion 8% Stocks $2,072 billion 32% Stocks 19%
Step by Step Solution
There are 3 Steps involved in it

Get step-by-step solutions from verified subject matter experts