

Question: 2. There were two primary absorption peaks yet only one emission peak at approximately 450 nm. Why was only one emission peak observed when there
2. There were two primary absorption peaks yet only one emission peak at approximately 450 nm. Why was only one emission peak observed when there are clearly two excitation (absorbance) peaks. i do not know which graph goes with this question but these are all the graphs i am given. please answer this question thoroughly
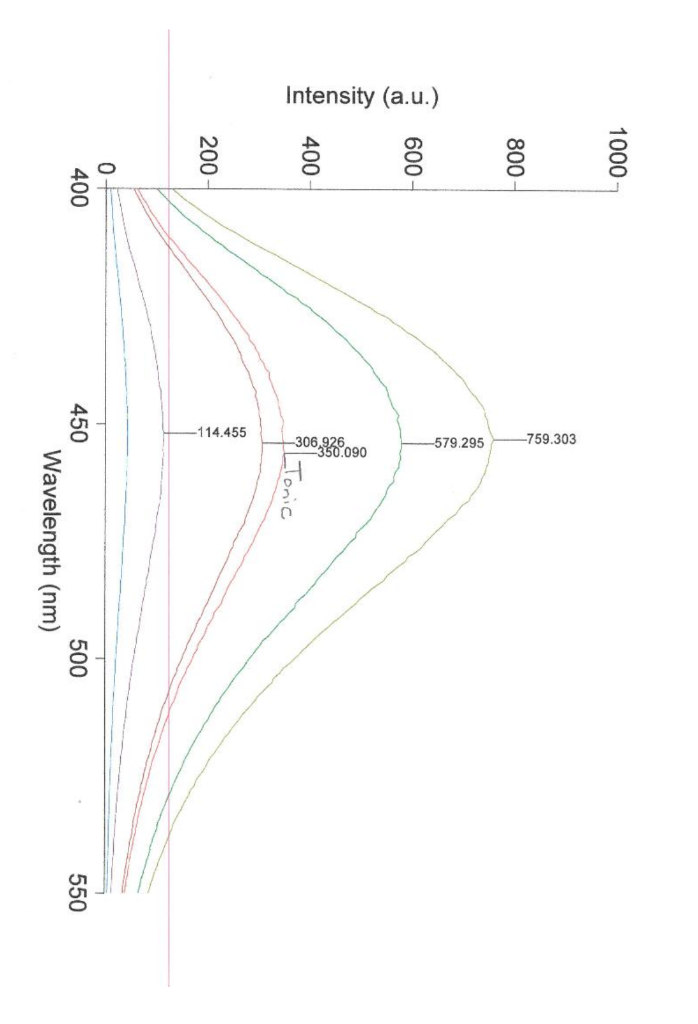
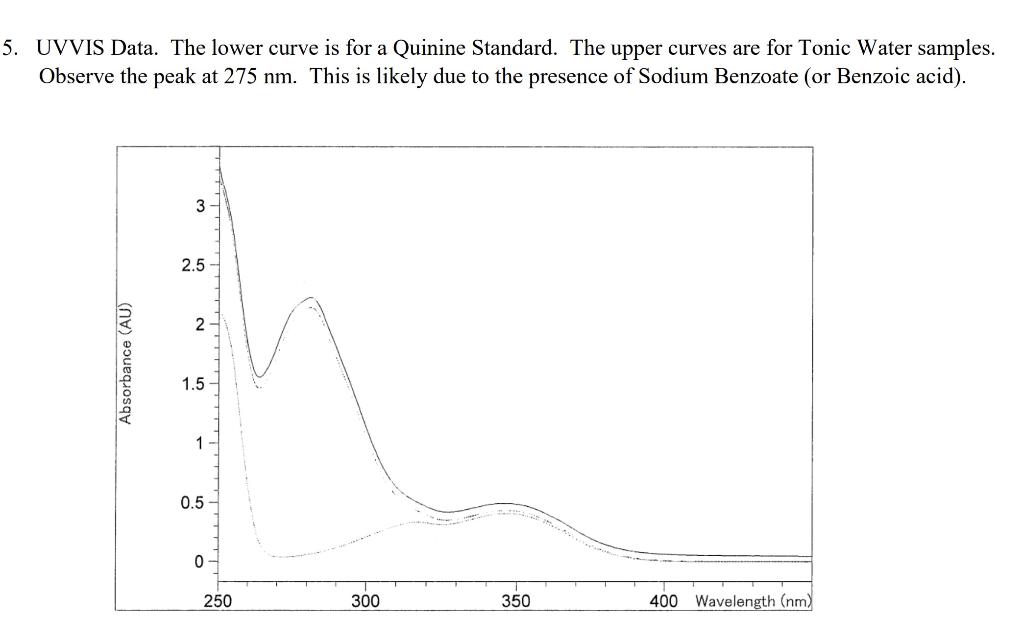
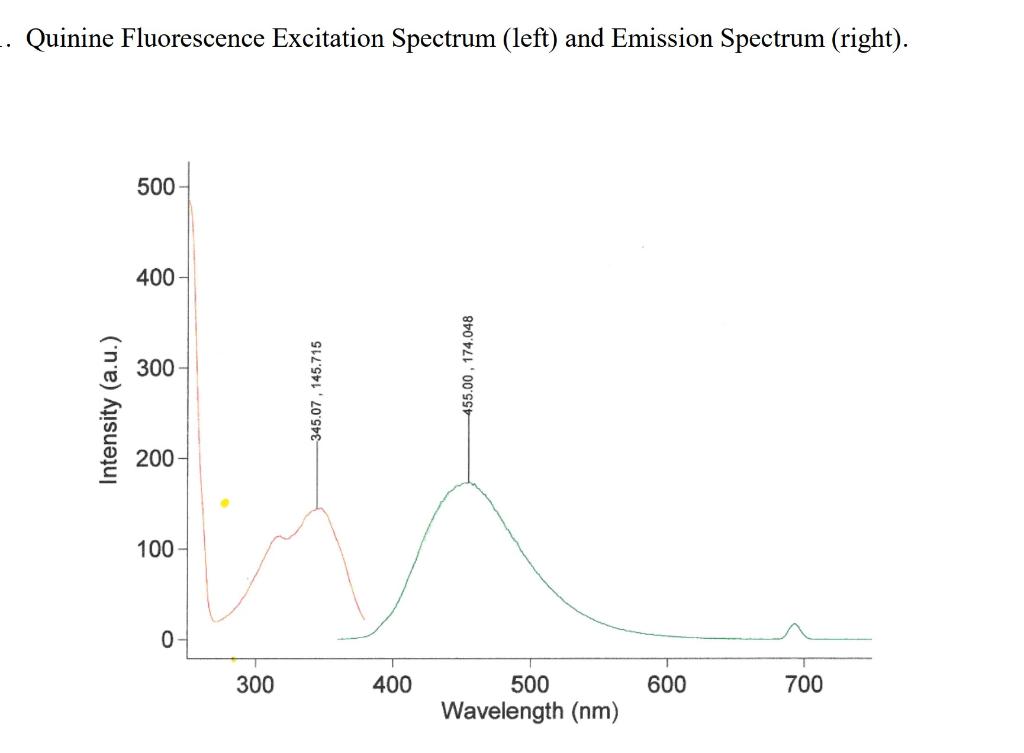
UVVIS Data. The lower curve is for a Quinine Standard. The upper curves are for Tonic Water samples. Observe the peak at 275nm. This is likely due to the presence of Sodium Benzoate (or Benzoic acid). Quinine Fluorescence Excitation Spectrum (left) and Emission Spectrum (right)
Step by Step Solution
There are 3 Steps involved in it
1 Expert Approved Answer
Step: 1 Unlock

Question Has Been Solved by an Expert!
Get step-by-step solutions from verified subject matter experts
Step: 2 Unlock
Step: 3 Unlock