

Question: 2. To create a vector map, go to http://www.acscle.com/. This is an educational tool that graphically illustrates great circles or shortest distance from one point
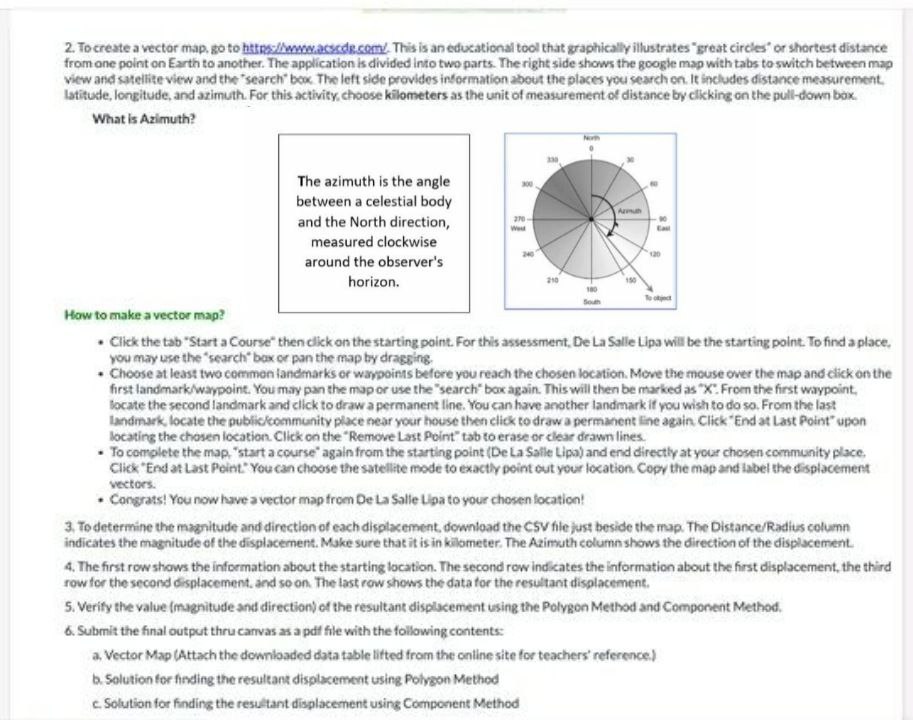
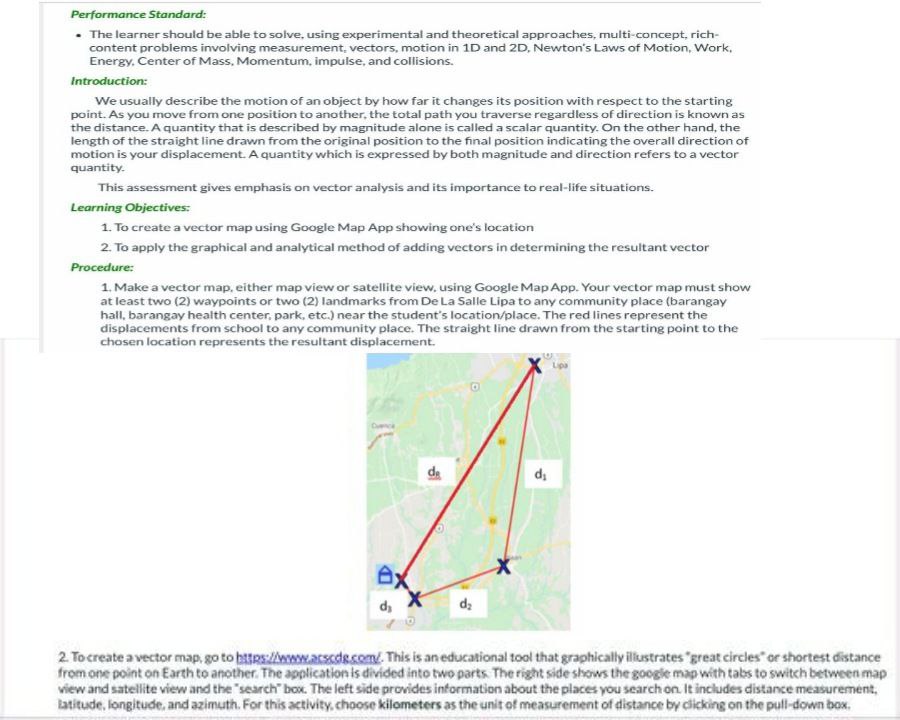
2. To create a vector map, go to http://www.acscle.com/. This is an educational tool that graphically illustrates "great circles" or shortest distance from one point on Earth to another. The application is divided into two parts. The right side shows the google map with tabs to switch between map view and satellite view and the "search" box. The left side provides information about the places you search on. It includes distance measurement. latitude, longitude, and azimuth. For this activity, choose kilometers as the unit of measurement of distance by clicking on the pull-down box. What is Azimuth? The azimuth is the angle between a celestial body and the North direction, 370 measured clockwise around the observer's horizon. How to make a vector map? . Click the tab "Start a Course" then click on the starting point. For this assessment, De La Salle Lipa will be the starting point. To find a place, you may use the "search" box or pan the map by dragging . Choose at least two common landmarks or waypoints before you reach the chosen location. Move the mouse over the map and click on the first landmark/waypoint. You may pan the map or use the "search" box again. This will then be marked as "X". From the first waypoint. locate the second landmark and click to draw a permanent line. You can have another landmark if you wish to do so. From the last Landmark, locate the public/community place near your house then click to draw a permanent line again, Click "End at Last Point" upon locating the chosen location. Click on the "Remove Last Point" tab to erase or clear drawn lines. To complete the map, "start a course" again from the starting point (De La Salle Lipa) and end directly at your chosen community place. Click "End at Last Point." You can choose the satellite mode to exactly point out your location. Copy the map and label the displacement vectors. . Congrats! You now have a vector map from De La Salle Lipa to your chosen tocation! 3, To determine the magnitude and direction of each displacement download the CSV file just beside the map. The Distance/Radius column indicates the magnitude of the displacement. Make sure that it is in kilometer. The Azimuth column shows the direction of the displacement 4. The first row shows the information about the starting location. The second row indicates the information about the first displacement, the third row for the second displacement. and so on. The last row shows the data for the resultant displacement. 5. Verify the value (magnitude and direction) of the resultant displacement using the Polygon Method and Component Method. 6. Submit the final output thru canvas as a pdf file with the following contents: a, Vector Map (Attach the downloaded data table lifted from the online site for teachers' reference.) b. Solution for finding the resultant displacement using Polygon Method c. Solution for finding the resultant displacement using Component MethodPerformance Standard: . The learner should be able to solve, using experimental and theoretical approaches, multi-concept, rich- content problems involving measurement, vectors, motion in 1D and 2D, Newton's Laws of Motion, Work, Energy. Center of Mass, Momentum, impulse, and collisions. Introduction: We usually describe the motion of an object by how far it changes its position with respect to the starting point. As you move from one position to another, the total path you traverse regardless of direction is known as the distance. A quantity that is described by magnitude alone is called a scalar quantity. On the other hand, the length of the straight line drawn from the original position to the final position indicating the overall direction of motion is your displacement. A quantity which is expressed by both magnitude and direction refers to a vector quantity. This assessment gives emphasis on vector analysis and its importance to real-life situations. Learning Objectives: 1. To create a vector map using Google Map App showing one's location 2. To apply the graphical and analytical method of adding vectors in determining the resultant vector Procedure: 1. Make a vector map, either map view or satellite view. using Google Map App. Your vector map must show at least two (2) waypoints or two (2) landmarks from De La Salle Lipa to any community place (barangay hall, barangay health center, park, etc.) near the student's location/place. The red lines represent the displacements from school to any community place. The straight line drawn from the starting point to the chosen location represents the resultant displacement. ex 2. To create a vector map, go to https://www.acscdg.com/. This is an educational tool that graphically illustrates "great circles" or shortest distance from one point on Earth to another. The application is divided into two parts. The right side shows the google map with tabs to switch between map view and satellite view and the "search" box. The left side provides information about the places you search on. It includes distance measurement, Latitude, longitude, and azimuth. For this activity. choose kilometers as the unit of measurement of distance by clicking on the pull-down box
Step by Step Solution
There are 3 Steps involved in it

Get step-by-step solutions from verified subject matter experts