Question: 2. (Total 32 points) Random sample of size 4 are selected on the length of a connector pin with the raw data shown in Table
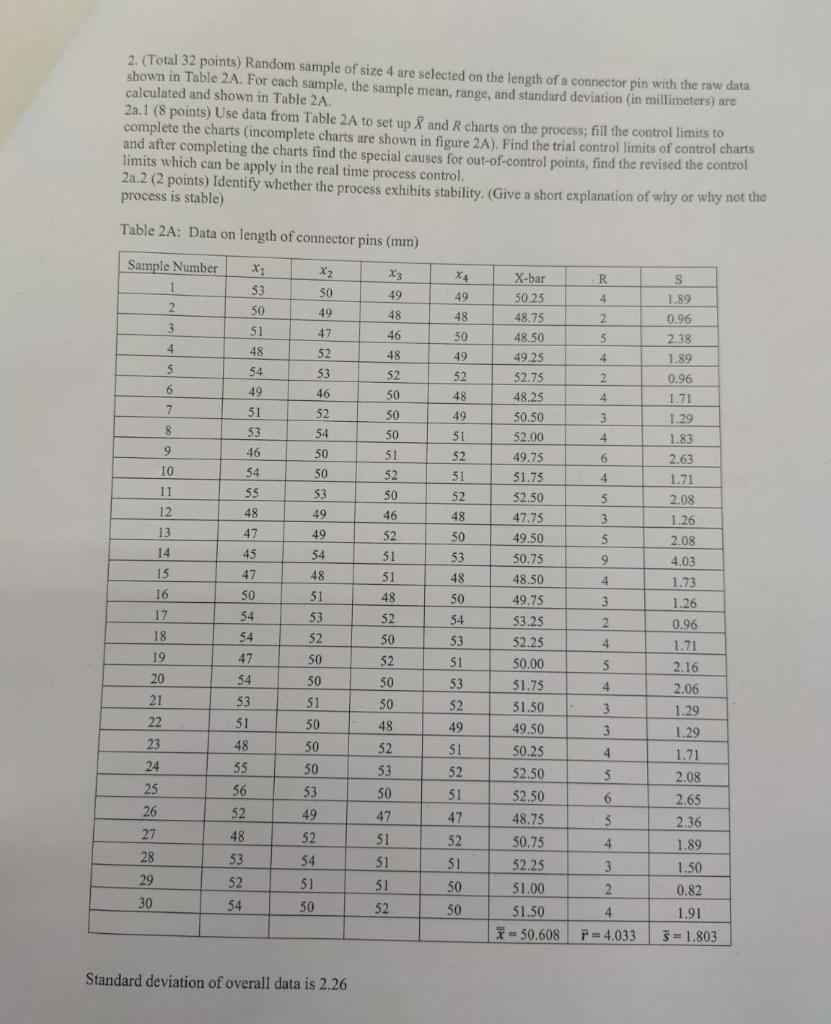
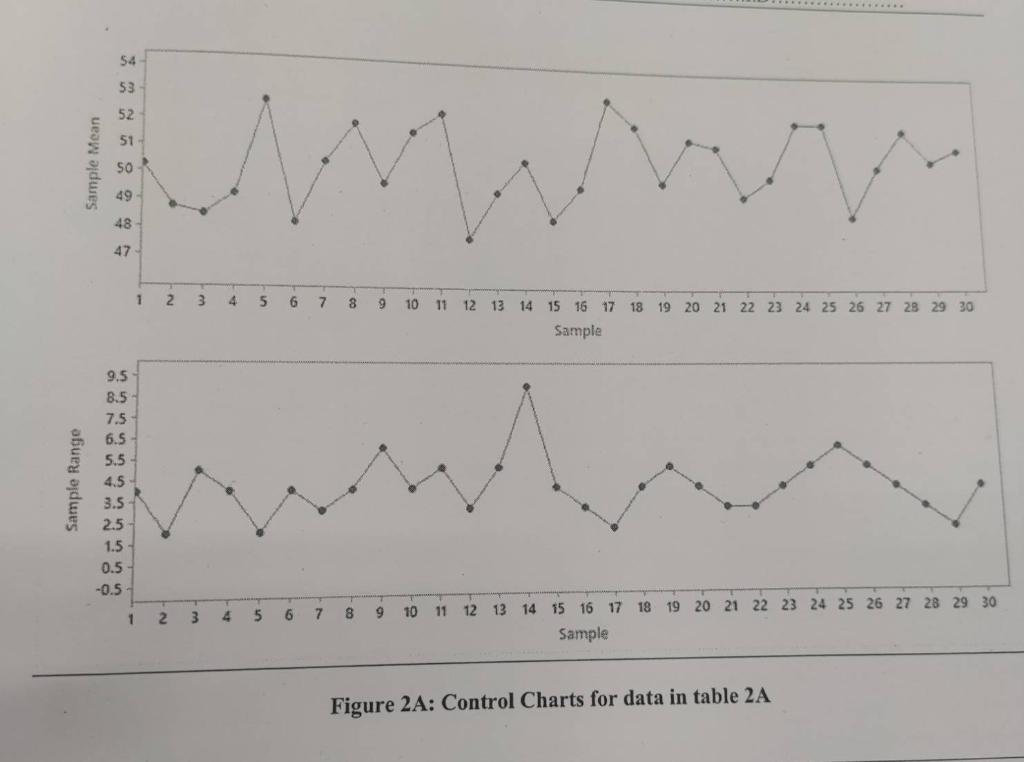

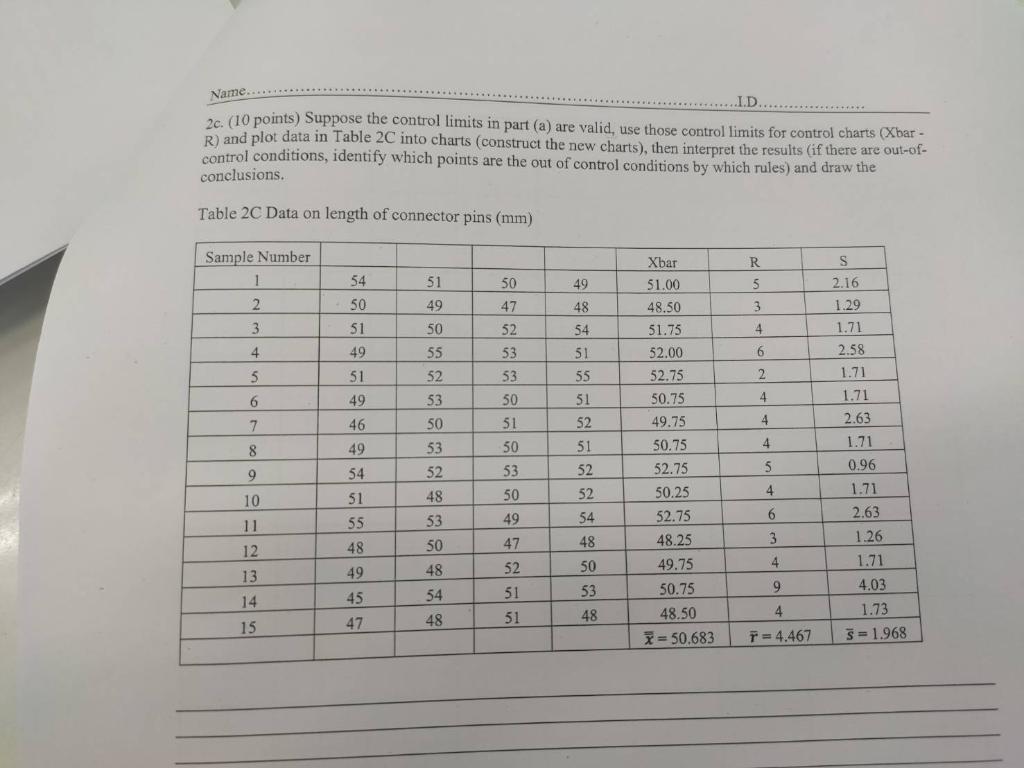
2. (Total 32 points) Random sample of size 4 are selected on the length of a connector pin with the raw data shown in Table 2A. For each sample, the sample mean, range, and standard deviation (in millimeters) are calculated and shown in Table 2A, 21.1 (8 points) Use data from Table 2A to set up X and R charts on the process; fill the control limits to complete the charts (incomplete charts are shown in figure 2A). Find the trial control limits of control charts and after completing the charts find the special causes for out-of-control points, find the revised the control limits which can be apply in the real time process control, 21.2 (2 points) Identify whether the process exhibits stability. (Give a short explanation of why or why not the process is stable) Table 2A: Data on length of connector pins (mm) Sample Number 1 X4 X2 SO S X1 53 50 51 X3 49 48 R 4 4 49 2 49 48 2 3 47 46 50 5 4 48 52 48 49 4 5 6 54 49 2 53 46 52 50 52 48 4 50 49 7 8 9 51 53 3 50 52 54 50 50 46 4 6 10 51 52 50 54 55 51 52 51 52 48 4 53 48 49 5 3 46 12 13 14 49 52 50 47 45 47 54 53 51 51 S 9 4 1.89 0.96 2.38 1.89 0.96 1.71 1.29 1.83 2.63 1.71 2.08 1.26 2.08 4.03 1.73 1.26 0.96 1.71 2.16 2.06 1.29 1.29 1.71 2.08 2.65 2.36 15 48 48 SO 51 48 16 17 X-bar 50.25 48.75 48.50 49.25 52.75 48.25 50.50 52.00 49.75 51.75 52.50 47.75 49.50 50.75 48.50 49.75 53.25 52.25 50.00 51.75 51.50 49.50 50.25 52.50 52.50 48.75 50.75 52.25 51.00 51.50 X-50.608 50 54 54 53 52 3 2 18 4 19 47 50 54 53 51 53 52 5 20 54 4 50 51 50 3 3 49 51 21 22 23 24 25 26 4 50 50 52 50 52 50 50 48 52 53 50 47 51 51 51 52 52 53 51 48 55 56 52 48 53 S 6 53 49 51 47 5 4 27 28 29 30 52 54 51 50 52 51 50 3 52 54 1.89 1.50 0.82 1.91 = 1.803 2 4 F = 4.033 50 1 Standard deviation of overall data is 2.26 54 53 52 51 50 49 48 47 1 2 3 4 5 6 7 8 9 10 11 12 13 14 15 16 17 18 19 20 21 22 23 24 25 26 27 28 29 30 Sample 9.5 8.5 7.5 6.5 5.5 4.5 3.5 2.5 1.5 0.5 -0.5 27 28 29 30 2 3 4 5 1 7 6 8 9 10 11 12 13 14 15 16 17 18 19 20 21 22 23 24 25 Sample Figure 2A: Control Charts for data in table 2A Name.. .......I.D..... 2b. (12 points) Use data from Table 2A and assume all data came from the stable process. If the length specifications are 50 3,5 mm., calculate all the process capability indices and interpret the results. What can you say about the capability of this process? What fractions of scrap or rework produced by this process are likely to be out of specification limits? Name. ID 20. (10 points) Suppose the control limits in part (a) are valid, use those control limits for control charts (Xbar - R) and plot data in Table 2C into charts (construct the new charts), then interpret the results (if there are out-of- control conditions, identify which points are the out of control conditions by which rules) and draw the conclusions. Table 2C Data on length of connector pins (mm) Sample Number 1 2 R 5 51 50 49 54 50 51 49 47 48 3 4 3 54 4 49 51 52 53 53 50 51 51 55 Xbar 51.00 48.50 51.75 52.00 52.75 50.75 49.75 50.75 52.75 6 2 5 6 49 51 4 4 7 46 53 50 53 52 52 51 8 4 49 50 S 2.16 1.29 1.71 2.58 1.71 1.71 2.63 1.71 0.96 1.71 2.63 1.26 1.71 4.03 1.73 = 1.968 53 52 5 54 51 9 10 11 4 48 50 50.25 6 55 49 52 54 48 50 47 3 48 12 4 52 13 49 52.75 48.25 49.75 50.75 48.50 * = 50.683 9 45 48 54 48 51 14 15 53 48 4 47 51 T = 4.467 2. (Total 32 points) Random sample of size 4 are selected on the length of a connector pin with the raw data shown in Table 2A. For each sample, the sample mean, range, and standard deviation (in millimeters) are calculated and shown in Table 2A, 21.1 (8 points) Use data from Table 2A to set up X and R charts on the process; fill the control limits to complete the charts (incomplete charts are shown in figure 2A). Find the trial control limits of control charts and after completing the charts find the special causes for out-of-control points, find the revised the control limits which can be apply in the real time process control, 21.2 (2 points) Identify whether the process exhibits stability. (Give a short explanation of why or why not the process is stable) Table 2A: Data on length of connector pins (mm) Sample Number 1 X4 X2 SO S X1 53 50 51 X3 49 48 R 4 4 49 2 49 48 2 3 47 46 50 5 4 48 52 48 49 4 5 6 54 49 2 53 46 52 50 52 48 4 50 49 7 8 9 51 53 3 50 52 54 50 50 46 4 6 10 51 52 50 54 55 51 52 51 52 48 4 53 48 49 5 3 46 12 13 14 49 52 50 47 45 47 54 53 51 51 S 9 4 1.89 0.96 2.38 1.89 0.96 1.71 1.29 1.83 2.63 1.71 2.08 1.26 2.08 4.03 1.73 1.26 0.96 1.71 2.16 2.06 1.29 1.29 1.71 2.08 2.65 2.36 15 48 48 SO 51 48 16 17 X-bar 50.25 48.75 48.50 49.25 52.75 48.25 50.50 52.00 49.75 51.75 52.50 47.75 49.50 50.75 48.50 49.75 53.25 52.25 50.00 51.75 51.50 49.50 50.25 52.50 52.50 48.75 50.75 52.25 51.00 51.50 X-50.608 50 54 54 53 52 3 2 18 4 19 47 50 54 53 51 53 52 5 20 54 4 50 51 50 3 3 49 51 21 22 23 24 25 26 4 50 50 52 50 52 50 50 48 52 53 50 47 51 51 51 52 52 53 51 48 55 56 52 48 53 S 6 53 49 51 47 5 4 27 28 29 30 52 54 51 50 52 51 50 3 52 54 1.89 1.50 0.82 1.91 = 1.803 2 4 F = 4.033 50 1 Standard deviation of overall data is 2.26 54 53 52 51 50 49 48 47 1 2 3 4 5 6 7 8 9 10 11 12 13 14 15 16 17 18 19 20 21 22 23 24 25 26 27 28 29 30 Sample 9.5 8.5 7.5 6.5 5.5 4.5 3.5 2.5 1.5 0.5 -0.5 27 28 29 30 2 3 4 5 1 7 6 8 9 10 11 12 13 14 15 16 17 18 19 20 21 22 23 24 25 Sample Figure 2A: Control Charts for data in table 2A Name.. .......I.D..... 2b. (12 points) Use data from Table 2A and assume all data came from the stable process. If the length specifications are 50 3,5 mm., calculate all the process capability indices and interpret the results. What can you say about the capability of this process? What fractions of scrap or rework produced by this process are likely to be out of specification limits? Name. ID 20. (10 points) Suppose the control limits in part (a) are valid, use those control limits for control charts (Xbar - R) and plot data in Table 2C into charts (construct the new charts), then interpret the results (if there are out-of- control conditions, identify which points are the out of control conditions by which rules) and draw the conclusions. Table 2C Data on length of connector pins (mm) Sample Number 1 2 R 5 51 50 49 54 50 51 49 47 48 3 4 3 54 4 49 51 52 53 53 50 51 51 55 Xbar 51.00 48.50 51.75 52.00 52.75 50.75 49.75 50.75 52.75 6 2 5 6 49 51 4 4 7 46 53 50 53 52 52 51 8 4 49 50 S 2.16 1.29 1.71 2.58 1.71 1.71 2.63 1.71 0.96 1.71 2.63 1.26 1.71 4.03 1.73 = 1.968 53 52 5 54 51 9 10 11 4 48 50 50.25 6 55 49 52 54 48 50 47 3 48 12 4 52 13 49 52.75 48.25 49.75 50.75 48.50 * = 50.683 9 45 48 54 48 51 14 15 53 48 4 47 51 T = 4.467


