

Question: 2 Use the correct Excel functions to generate a chart und answer the questions below. You are given the Remue gmerated by each of the
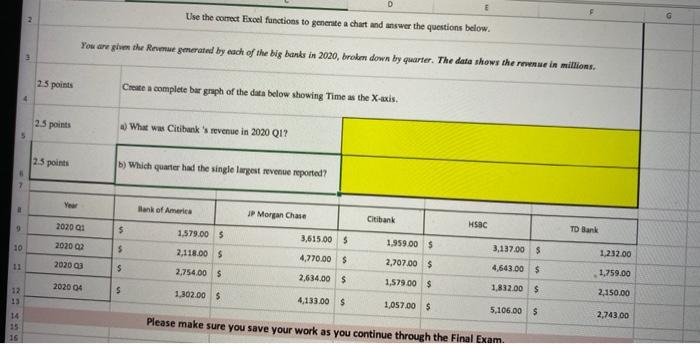
2 Use the correct Excel functions to generate a chart und answer the questions below. You are given the Remue gmerated by each of the big banks in 2020, broke down by quarter. The data shows the room in millions 23 points Create a complete bar graph of the data below showing Time as the X-axis. 4 2.5 points ..) What was Citibank's revenue in 2020 Q1? 23 points 1) Which quarter had the single largest revenue reported? Ver Bank of America JP Morgan Chase Citibank 2020 21 HSBC 9 5 TD Bank 3,615.00 $ 202002 10 1,959.00 $ 5 1.579.00 5 2,118.00 $ 2,754.00 5 3.137.00 $ 1.232.00 2020 23 11 2,707.00 $ $ 4.770.00 $ 2.634.00 $ 4,643.00 5 1,759.00 12 202004 1.579.00 $ 5 1,832.00 $ 1,302.00 $ 2,150.00 4,133.00 $ 1,057.00 5 5,106.00 $ 14 2,743.00 Please make sure you save your work as you continue through the Final Exam 16
Step by Step Solution
There are 3 Steps involved in it

Get step-by-step solutions from verified subject matter experts