

Question: 2. Use the data in the chart to create a production possibilities curve. 18 A B C D E Bubble Gum 30 28 24 16
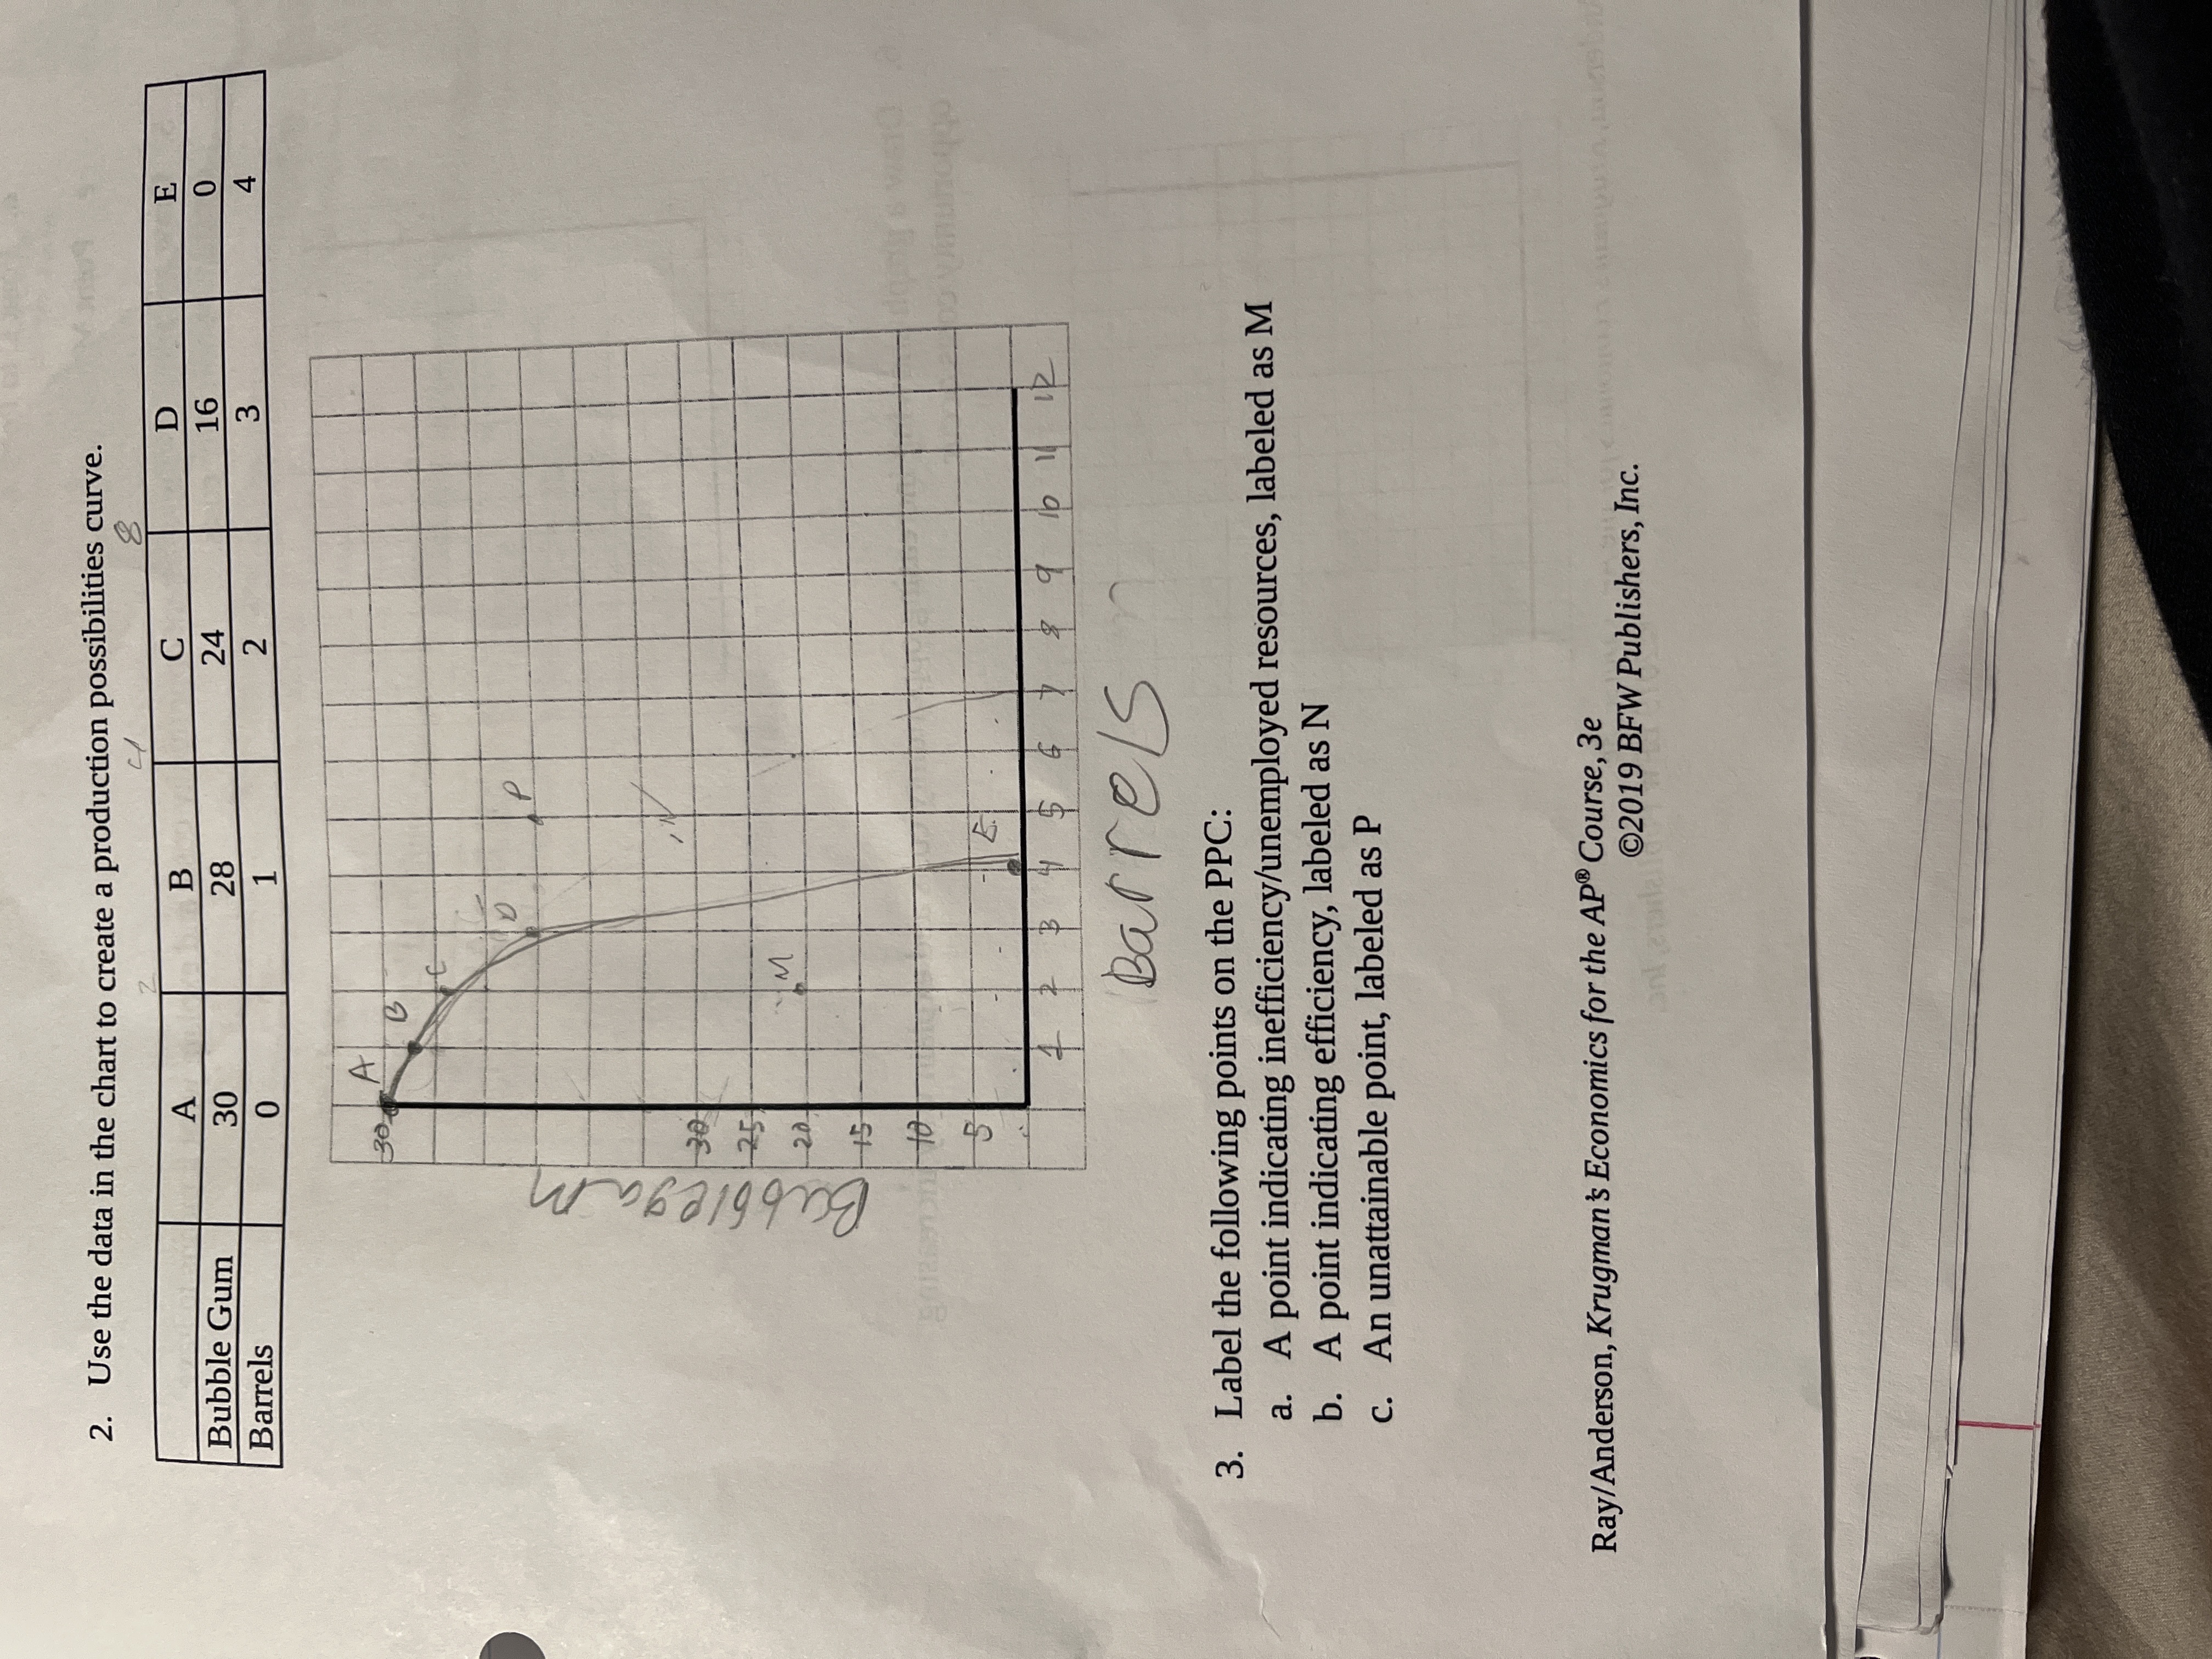
2. Use the data in the chart to create a production possibilities curve. 18 A B C D E Bubble Gum 30 28 24 16 0 Barrels 0 1 2 3 4 30 4 A Bubblegam 30 to Barrels 3. Label the following points on the PPC: a. A point indicating inefficiency/unemployed resources, labeled as M b. A point indicating efficiency, labeled as N c. An unattainable point, labeled as P Ray/Anderson, Krugman's Economics for the AP Course, 3e ant etoile 2019 BFW Publishers, Inc
Step by Step Solution
There are 3 Steps involved in it
Heres how to approach creating and labeling a Production Possibilities Curve PPC based on the data p... View full answer

Get step-by-step solutions from verified subject matter experts