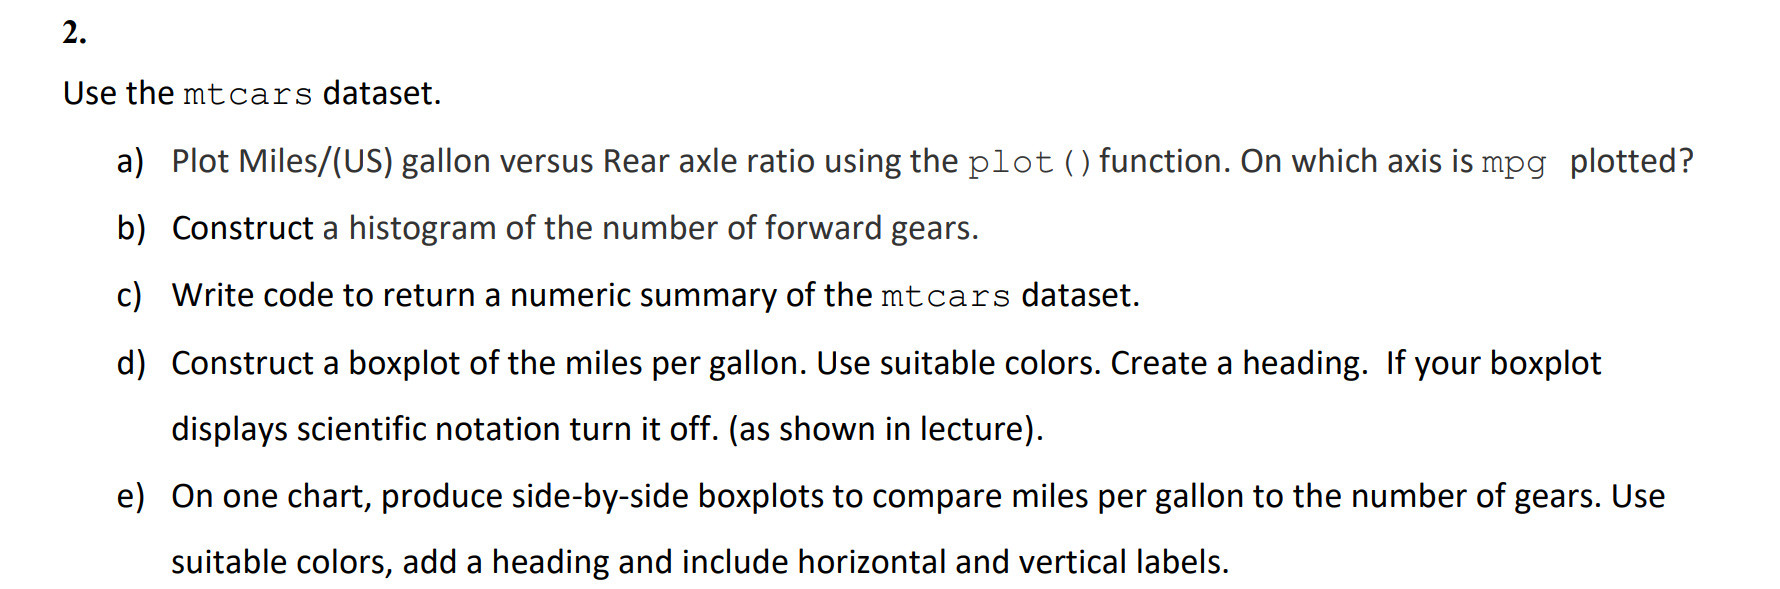
Question: 2. Use the mtcars dataset. a) Plot Miles/(US) gallon versus Rear axle ratio using the plot () function. On which axis is mpg plotted? b)

2. Use the mtcars dataset. a) Plot Miles/(US)

2. Use the mtcars dataset. a) Plot Miles/(US) gallon versus Rear axle ratio using the plot () function. On which axis is mpg plotted? b) Construct a histogram of the number of forward gears. c) Write code to return a numeric summary of the mtcars dataset. d) Construct a boxplot of the miles per gallon. Use suitable colors. Create a heading. If your boxplot displays scientific notation turn it off. (as shown in lecture). e) On one chart, produce side-by-side boxplots to compare miles per gallon to the number of gears. Use suitable colors, add a heading and include horizontal and vertical labels

Step by Step Solution

There are 3 Steps involved in it

1 Expert Approved Answer
Step: 1 Unlock blur-text-image
Question Has Been Solved by an Expert!

Get step-by-step solutions from verified subject matter experts

Step: 2 Unlock
Step: 3 Unlock

Students Have Also Explored These Related General Management Questions!