

Question: 2) Use the same frequency distribution you created in the college pizza problem to answer the following question. What percentage of college students ate pizza
- 2) Use the same frequency distribution you created in the college pizza problem to answer the following question.
- What percentage of college students ate pizza at least 4 times? Only include the number, not the percent sign.
- 3) What percentage of college students ate pizza between 2 and 4 times (include 2, 3, 4)? Only include the number, not the percent sign.
- 4) What percentage of college students ate pizza 3 times in the last 2 weeks? Only include the number, not the percent sign.
- 5) What was N in the college pizza problem?
- 6) What was the frequency for the score of 3 times of eating pizza in the previous 2 weeks?
- 7) What was the percentage of the score of 2 pizzas in 2 weeks? Do not put the percentage symbol. Only provide the number.
- 8) What was the cumulative frequency at the score of 5 pizzas in two weeks?
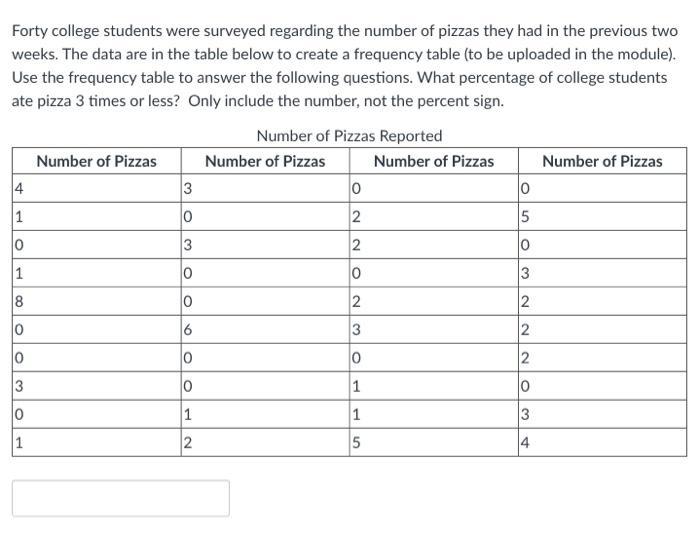
Forty college students were surveyed regarding the number of pizzas they had in the previous two weeks. The data are in the table below to create a frequency table (to be uploaded in the module). Use the frequency table to answer the following questions. What percentage of college students ate pizza 3 times or less? Only include the number, not the percent sign. 4 1 0 1 8 0 0 3 0 1 Number of Pizzas 3 0 3 0 0 6 0 0 1 2 Number of Pizzas Reported Number of Pizzas 0 2 2 0 2 3 0 1 1 5 Number of Pizzas 0 5 0 3 2 2 2 0 3 4 Number of Pizzas
Step by Step Solution
There are 3 Steps involved in it
1 Expert Approved Answer
Step: 1 Unlock

Question Has Been Solved by an Expert!
Get step-by-step solutions from verified subject matter experts
Step: 2 Unlock
Step: 3 Unlock