

Question: 2. Using a contribution margin income statement format, create the static-budget (master budget), sales-activity, and flexible-budget variances and identify as favorable or unfavorable. Next, provide
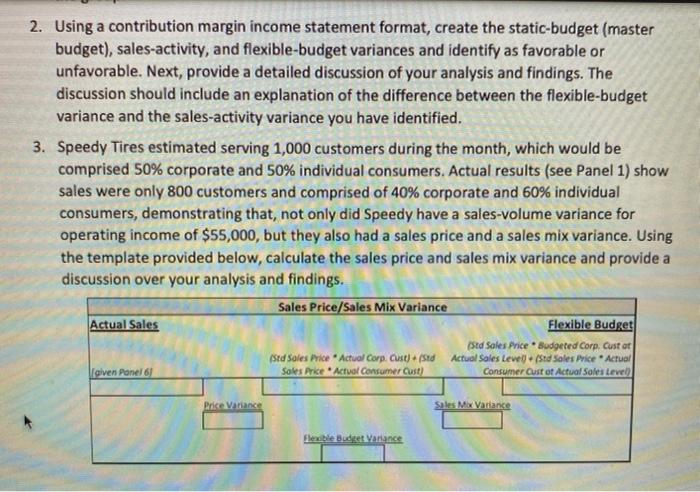
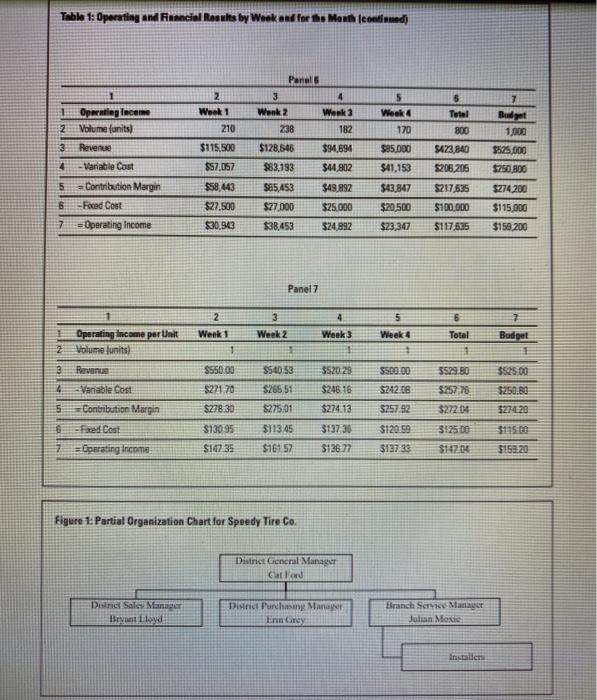
2. Using a contribution margin income statement format, create the static-budget (master budget), sales-activity, and flexible-budget variances and identify as favorable or unfavorable. Next, provide a detailed discussion of your analysis and findings. The discussion should include an explanation of the difference between the flexible-budget variance and the sales-activity variance you have identified. 3. Speedy Tires estimated serving 1,000 customers during the month, which would be comprised 50% corporate and 50% individual consumers. Actual results (see Panel 1) show sales were only 800 customers and comprised of 40% corporate and 60% individual consumers, demonstrating that, not only did Speedy have a sales-volume variance for operating income of $55,000, but they also had a sales price and a sales mix variance. Using the template provided below, calculate the sales price and sales mix variance and provide a discussion over your analysis and findings. Sales Price/Sales Mix Variance Actual Sales Flexible Budget Std Sales Price Budgeted Corp. Custar (Sed Sales Price Actual Corp. Cust) + (Std Actual Sales Level. /Std Sales Price Actual Soles Price Actual Consumer Cust) Consumer Custot Actual Sales Level) given Ponel 61 Price Variance Sales Mox Variance Flexible Budget anane Table 1: Operating and Financial Results by Wook and for the Moun continued) 2 Week 1 210 Panel 3 4 Werk 2 Week 3 182 $128.546 $94.691 $83,193 $44.802 7 Budget 1.000 238 6 Total 800 S423,840 5205, 206 3 Operating Income Volume units) Revenue Variable Cost Contribution Margin Fored Cost = Operating Income $115.500 4 5 Week 170 $85.000 $41,153 $43.847 $20,500 $23,347 $525.000 $250 800 $57,057 $58443 $49.892 $85,453 $27.000 5217635 $100.000 $25.000 $27.500 $30,313 $274200 $115,000 $159 200 $38,453 $24.92 $117,635 Panel 7 3 Week 2 4 Week 3 5 Week 4 6 Total Werk 1 Budget Operating income per Unit 2 Volume units Revenue # Vanable Cost Contribution Margin $525.00 $550.00 $22178 $S40.53 $26551 $52029 $24616 $500.00 $242.00 5257 92 5529.00 3257.26 $272 04 3:25.00 $275,01 $274.13 $278.30 $13095 $14735 $120.59 $113.45 $16:52 $13735 $136.77 Operating Income $14704 $159.20 Figure 1: Partial Organization Chart for Speedy Tire Co. District General Manager Carla Die Sales Manape District Purcha. Mana Ein Grey Branch Sty Manager Julian Moxie Incide 2. Using a contribution margin income statement format, create the static-budget (master budget), sales-activity, and flexible-budget variances and identify as favorable or unfavorable. Next, provide a detailed discussion of your analysis and findings. The discussion should include an explanation of the difference between the flexible-budget variance and the sales-activity variance you have identified. 3. Speedy Tires estimated serving 1,000 customers during the month, which would be comprised 50% corporate and 50% individual consumers. Actual results (see Panel 1) show sales were only 800 customers and comprised of 40% corporate and 60% individual consumers, demonstrating that, not only did Speedy have a sales-volume variance for operating income of $55,000, but they also had a sales price and a sales mix variance. Using the template provided below, calculate the sales price and sales mix variance and provide a discussion over your analysis and findings. Sales Price/Sales Mix Variance Actual Sales Flexible Budget Std Sales Price Budgeted Corp. Custar (Sed Sales Price Actual Corp. Cust) + (Std Actual Sales Level. /Std Sales Price Actual Soles Price Actual Consumer Cust) Consumer Custot Actual Sales Level) given Ponel 61 Price Variance Sales Mox Variance Flexible Budget anane Table 1: Operating and Financial Results by Wook and for the Moun continued) 2 Week 1 210 Panel 3 4 Werk 2 Week 3 182 $128.546 $94.691 $83,193 $44.802 7 Budget 1.000 238 6 Total 800 S423,840 5205, 206 3 Operating Income Volume units) Revenue Variable Cost Contribution Margin Fored Cost = Operating Income $115.500 4 5 Week 170 $85.000 $41,153 $43.847 $20,500 $23,347 $525.000 $250 800 $57,057 $58443 $49.892 $85,453 $27.000 5217635 $100.000 $25.000 $27.500 $30,313 $274200 $115,000 $159 200 $38,453 $24.92 $117,635 Panel 7 3 Week 2 4 Week 3 5 Week 4 6 Total Werk 1 Budget Operating income per Unit 2 Volume units Revenue # Vanable Cost Contribution Margin $525.00 $550.00 $22178 $S40.53 $26551 $52029 $24616 $500.00 $242.00 5257 92 5529.00 3257.26 $272 04 3:25.00 $275,01 $274.13 $278.30 $13095 $14735 $120.59 $113.45 $16:52 $13735 $136.77 Operating Income $14704 $159.20 Figure 1: Partial Organization Chart for Speedy Tire Co. District General Manager Carla Die Sales Manape District Purcha. Mana Ein Grey Branch Sty Manager Julian Moxie Incide
Step by Step Solution
There are 3 Steps involved in it

Get step-by-step solutions from verified subject matter experts