

Question: 2. Using a scatter diagram, show the correlation between the number of total enrolment of XYZ University and its annual profit. TOTAL ANNUAL YEAR ENROLMENT
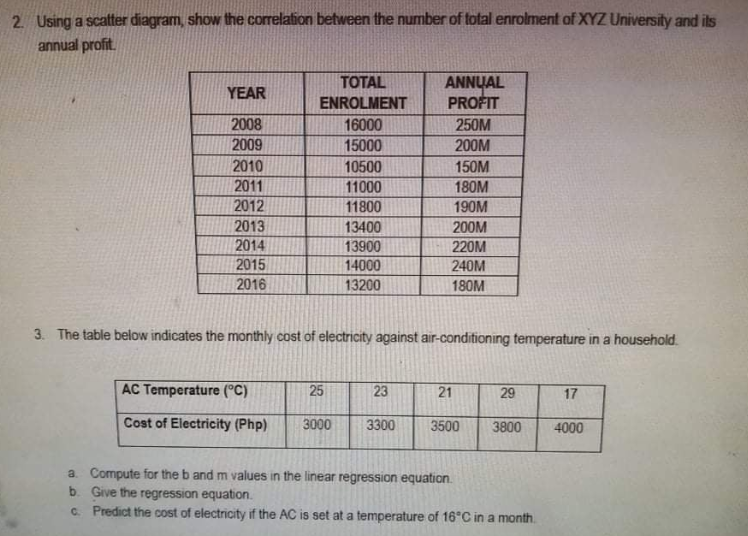
2. Using a scatter diagram, show the correlation between the number of total enrolment of XYZ University and its annual profit. TOTAL ANNUAL YEAR ENROLMENT PROFIT 2008 16000 250M 2009 15000 200M 2010 10500 150M 2011 11000 180M 2012 11800 190M 2013 13400 200M 2014 13900 220M 2015 14000 240M 2016 13200 180M 3. The table below indicates the monthly cost of electricity against air-conditioning temperature in a household. AC Temperature (C) 25 23 21 29 17 Cost of Electricity (Php) 3000 3300 3500 3800 4000 a. Compute for the b and m values in the linear regression equation. b. Give the regression equation. C. Predict the cost of electricity if the AC is set at a temperature of 16*C in a month
Step by Step Solution
There are 3 Steps involved in it

Get step-by-step solutions from verified subject matter experts