

Question: 2. Using data from the World Development Indicators to find out the real GDP per capita of the United States and that of China in
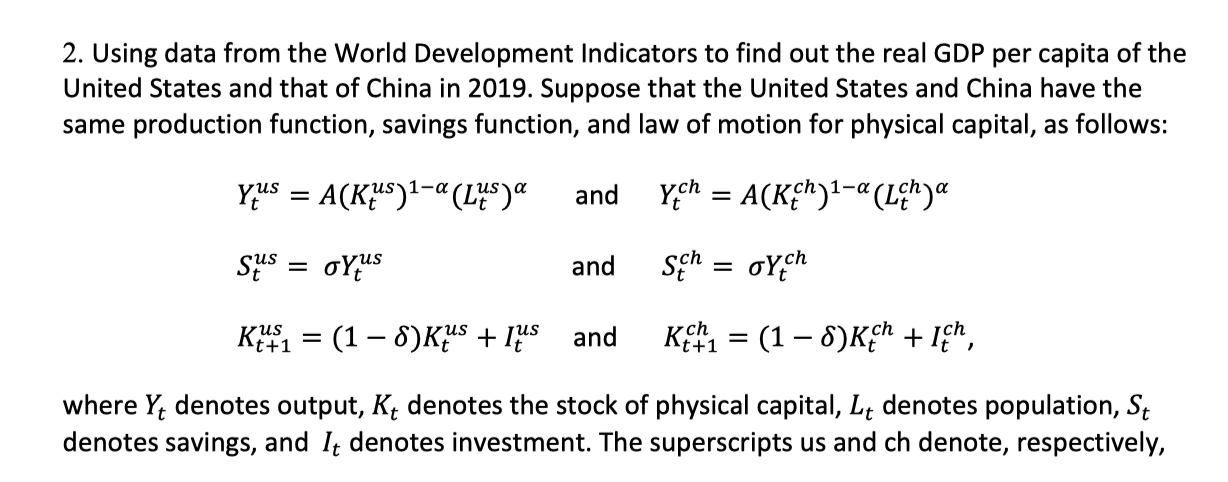
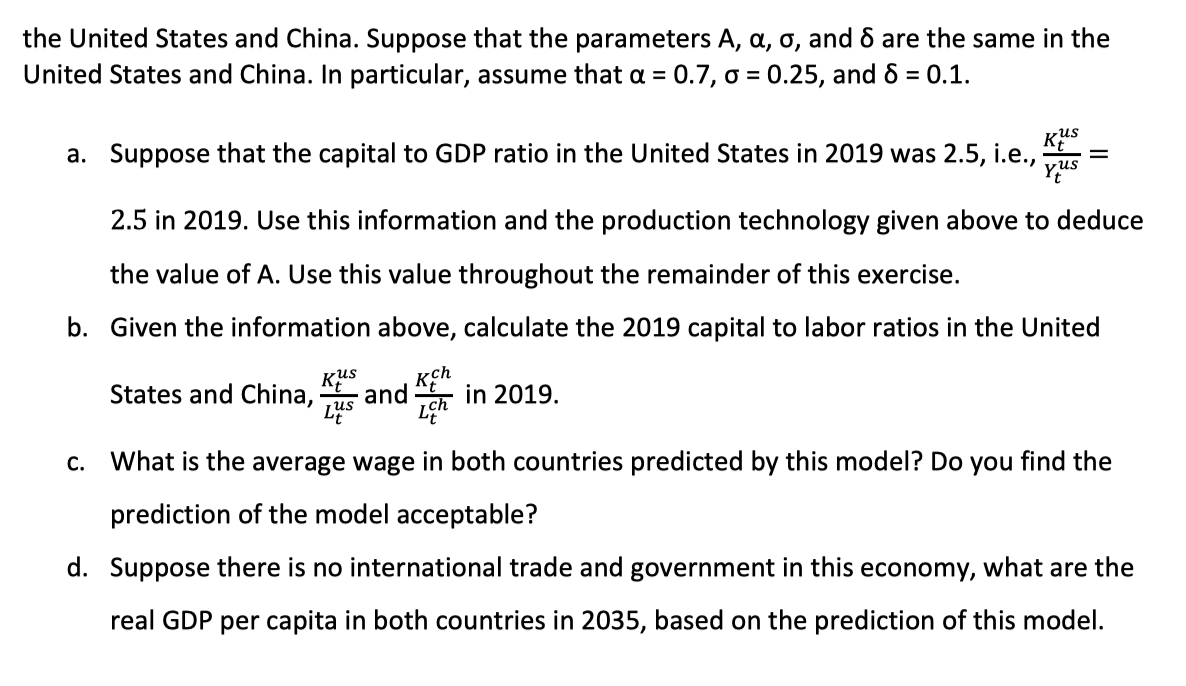
2. Using data from the World Development Indicators to find out the real GDP per capita of the United States and that of China in 2019. Suppose that the United States and China have the same production function, savings function, and law of motion for physical capital, as follows: Yius = A(KUS)1-a (Ls)a and Ych = A(KEN) 1-a (LE)a sus = oyus and sch = orch t+1 (1 SK4s + lus and Kimi = (1 - 8)Kch +, where Yt denotes output, Kt denotes the stock of physical capital, Lt denotes population, St denotes savings, and It denotes investment. The superscripts us and ch denote, respectively, the United States and China. Suppose that the parameters A, a, o, and 8 are the same in the United States and China. In particular, assume that a = 0.7, o = 0.25, and 8 = 0.1. a. Suppose that the capital to GDP ratio in the United States in 2019 was 2.5, i.e., Ks yus 2.5 in 2019. Use this information and the production technology given above to deduce the value of A. Use this value throughout the remainder of this exercise. b. Given the information above, calculate the 2019 capital to labor ratios in the United States and China, kus Kch and LUS ch in 2019. C. What is the average wage in both countries predicted by this model? Do you find the prediction of the model acceptable? d. Suppose there is no international trade and government in this economy, what are the real GDP per capita in both countries in 2035, based on the prediction of this model
Step by Step Solution
There are 3 Steps involved in it

Get step-by-step solutions from verified subject matter experts