Question: 2. Using the Five Generic Competitive Strategies Matrix, how would you evaluate Walmarts more recent, emergent strategy? (See Figure 5.1 in the text) 3. What
2. Using the Five Generic Competitive Strategies Matrix, how would you evaluate Walmarts more recent, emergent strategy? (See Figure 5.1 in the text)
3. What does a Five-Force analysis for Walmart reveal about its current position in the retail industry? What moves are rivals making that could be considered threats to Walmart? Should Walmart be satisfied with its current position?
4. What does a financial ratio analysis reveal about Walmarts current position? (Use the financial ratios in the Appendix of the text as a guide in doing your financial analysis.)
5. Evaluate Walmarts recent moves to acquire businesses.
6. Based on your evaluations, what it would take for Walmart to compete successfully in the retailing industry in 2018 and beyond?
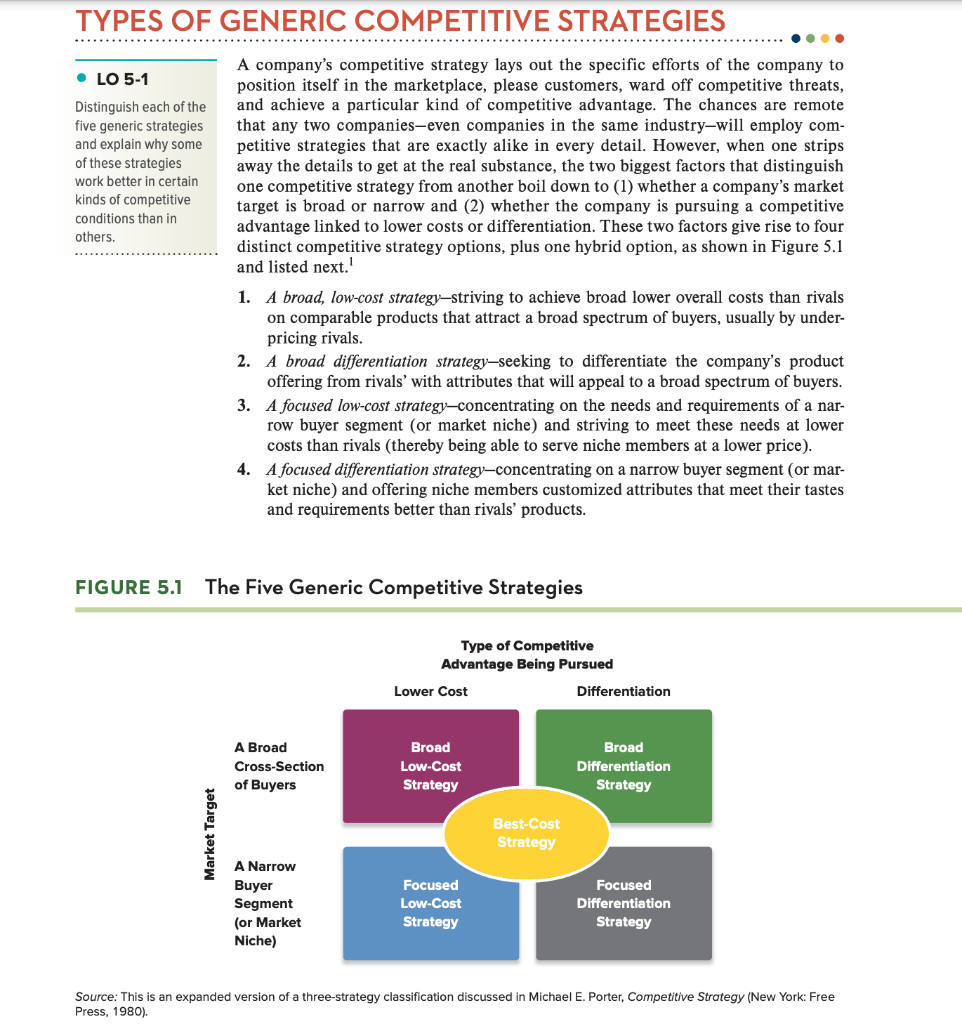
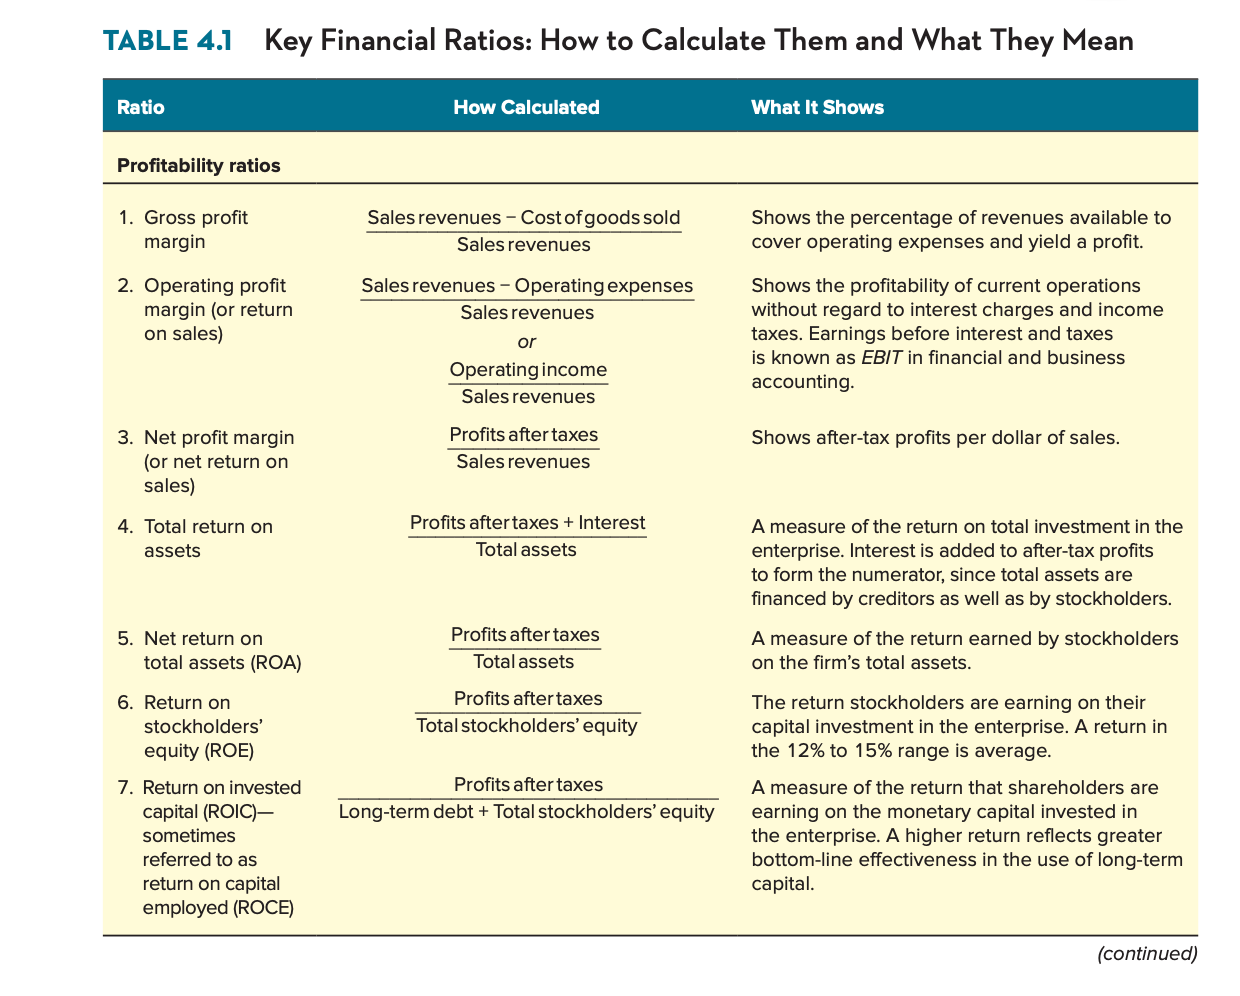
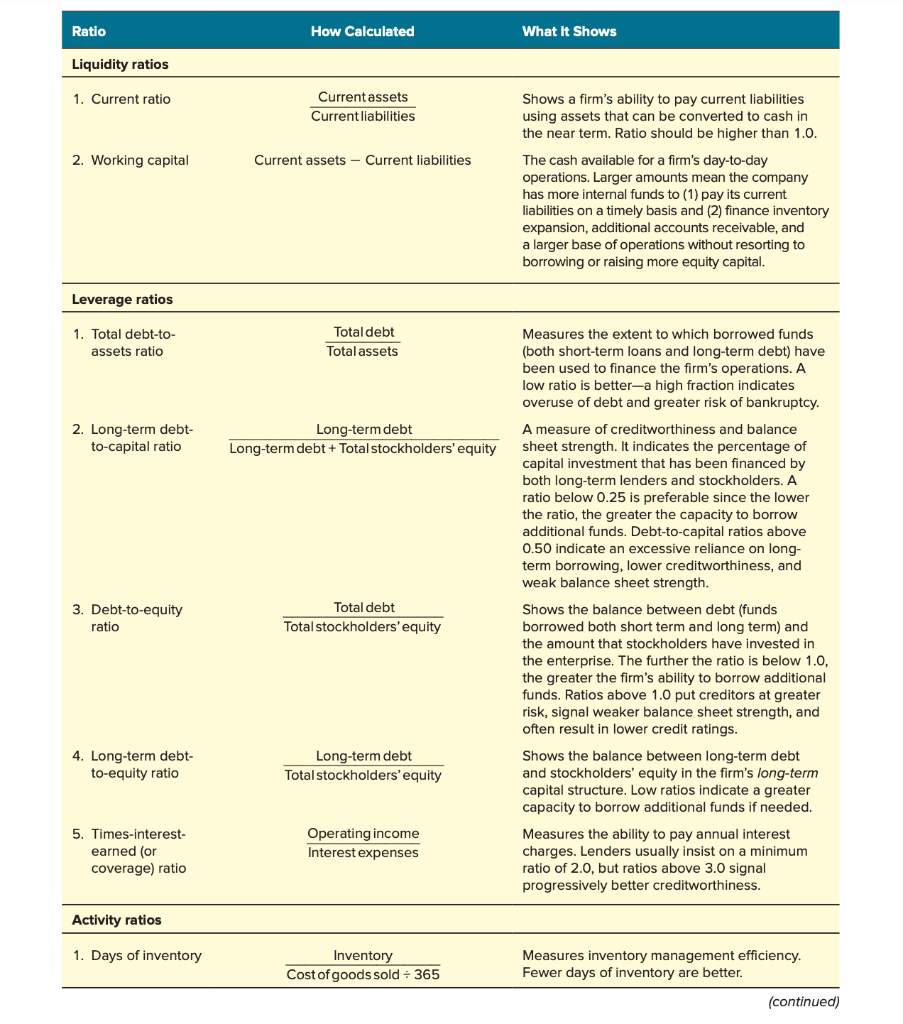
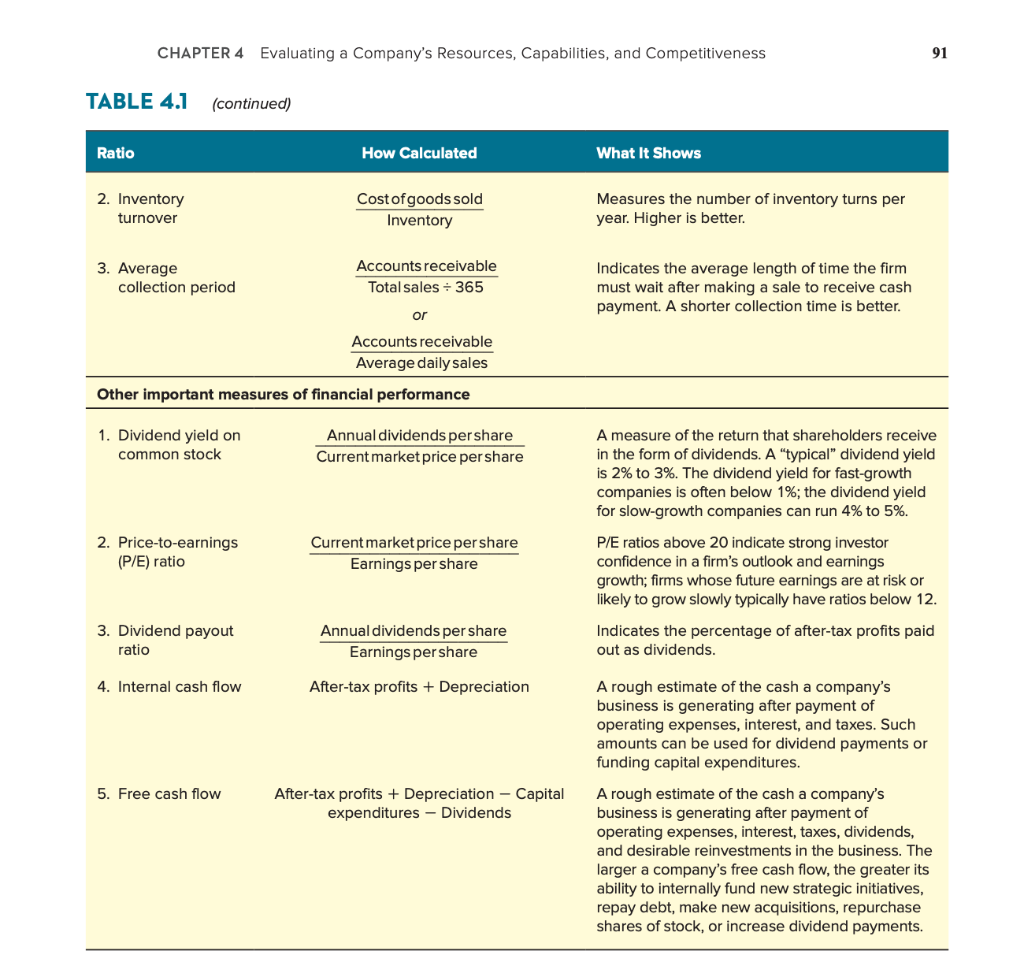
TYPES OF GENERIC COMPETITIVE STRATEGIES LO 5-1 Distinguish each of the five generic strategies and explain why some of these strategies work better in certain kinds of competitive conditions than in others. A company's competitive strategy lays out the specific efforts of the company to position itself in the marketplace, please customers, ward off competitive threats, and achieve a particular kind of competitive advantage. The chances are remote that any two companies-even companies in the same industry-will employ com- petitive strategies that are exactly alike in every detail. However, when one strips away the details to get at the real substance, the two biggest factors that distinguish one competitive strategy from another boil down to (1) whether a company's market target is broad or narrow and (2) whether the company is pursuing a competitive advantage linked to lower costs or differentiation. These two factors give rise to four distinct competitive strategy options, plus one hybrid option, as shown in Figure 5.1 and listed next. 1. A broad, low-cost strategy-striving to achieve broad lower overall costs than rivals on comparable products that attract a broad spectrum of buyers, usually by under- pricing rivals. 2. A broad differentiation strategy-seeking to differentiate the company's product offering from rivals' with attributes that will appeal to a broad spectrum of buyers. 3. A focused low-cost strategy-concentrating on the needs and requirements of a nar- row buyer segment (or market niche) and striving to meet these needs at lower costs than rivals (thereby being able to serve niche members at a lower price). 4. A focused differentiation strategy-concentrating on a narrow buyer segment (or mar- ket niche) and offering niche members customized attributes that meet their tastes and requirements better than rivals' products. FIGURE 5.1 The Five Generic Competitive Strategies Type of Competitive Advantage Being Pursued Lower Cost Differentiation A Broad Cross-Section of Buyers Broad Low-Cost Strategy Broad Differentiation Strategy Market Target Best-Cost Strategy A Narrow Buyer Segment (or Market Niche) Focused Low-Cost Strategy Focused Differentiation Strategy Source: This is an expanded version of a three-strategy classification discussed in Michael E. Porter, Competitive Strategy (New York: Free Press, 1980). TABLE 4.1 Key Financial Ratios: How to Calculate Them and What They Mean Ratio How Calculated What It Shows Profitability ratios 1. Gross profit margin Sales revenues - Cost of goods sold Sales revenues Shows the percentage of revenues available to cover operating expenses and yield a profit. 2. Operating profit margin (or return on sales) Sales revenues - Operating expenses Sales revenues Shows the profitability of current operations without regard to interest charges and income taxes. Earnings before interest and taxes is known as EBIT in financial and business accounting or Operating income Sales revenues 3. Net profit margin net return sales) Profits after taxes Sales revenues Shows after-tax profits per dollar of sales. 4. Total return on assets Profits after taxes + Interest Total assets A measure of the return on total investment in the enterprise. Interest is added to after-tax profits to form the numerator, since total assets are financed by creditors as well as by stockholders. 5. Net return on total assets (ROA) Profits after taxes Total assets A measure of the return earned by stockholders on the firm's total assets. 6. Return on stockholders' equity (ROE) Profits after taxes Total stockholders' equity The return stockholders are earning on their capital investment in the enterprise. A return in the 12% to 15% range is average. Profits after taxes Long-term debt + Total stockholders' equity 7. Return on invested capital (ROIC)- sometimes referred to as return on capital employed (ROCE) A measure of the return that shareholders are earning on the monetary capital invested in the enterprise. A higher return reflects greater bottom-line effectiveness in the use of long-term capital. (continued) Ratio How Calculated What It Shows Liquidity ratios 1. Current ratio Current assets Current liabilities 2. Working capital Current assets - Current liabilities Shows a firm's ability to pay current liabilities using assets that can be converted to cash in the near term. Ratio should be higher than 1.0. The cash available for a firm's day-to-day operations. Larger amounts mean the company has more internal funds to (1) pay its current liabilities on a timely basis and (2) finance inventory expansion, additional accounts receivable, and a larger base of operations without resorting to borrowing or raising more equity capital. Leverage ratios 1. Total debt-to- assets ratio Total debt Total assets 2. Long-term debt- to-capital ratio Long-term debt Long-term debt + Total stockholders' equity 3. Debt-to-equity ratio Total debt Total stockholders' equity Measures the extent to which borrowed funds (both short-term loans and long-term debt) have been used to finance the firm's operations. A low ratio is better-a high fraction indicates overuse of debt and greater risk of bankruptcy. A measure of creditworthiness and balance sheet strength. It indicates the percentage of capital investment that has been financed by both long-term lenders and stockholders. A ratio below 0.25 is preferable since the lower the ratio, the greater the capacity to borrow additional funds. Debt-to-capital ratios above 0.50 indicate an excessive reliance on long- term borrowing, lower creditworthiness, and weak balance sheet strength. Shows the balance between debt (funds borrowed both short term and long term) and the amount that stockholders have invested in the enterprise. The further the ratio is below 1.0, the greater the firm's ability to borrow additional funds. Ratios above 1.0 put creditors at greater risk, signal weaker balance sheet strength, and often result in lower credit ratings. Shows the balance between long-term debt and stockholders' equity in the firm's long-term capital structure. Low ratios indicate a greater capacity to borrow additional funds if needed. Measures the ability to pay annual interest charges. Lenders usually insist on a minimum ratio of 2.0, but ratios above 3.0 signal progressively better creditworthiness. 4. Long-term debt- to-equity ratio Long-term debt Total stockholders'equity 5. Times-interest- earned (or coverage) ratio Operating income Interest expenses Activity ratios 1. Days of inventory Inventory Cost of goods sold = 365 Measures inventory management efficiency. Fewer days of inventory are better. (continued) CHAPTER 4 Evaluating a Company's Resources, Capabilities, and Competitiveness 91 TABLE 4.1 (continued) Ratio How Calculated What It Shows 2. Inventory turnover Cost of goods sold Inventory Measures the number of inventory turns per year. Higher is better. 3. Average collection period Accounts receivable Total sales - 365 Indicates the average length of time the firm must wait after making a sale to receive cash payment. A shorter collection time is better. or Accounts receivable Average daily sales Other important measures of financial performance 1. Dividend yield on common stock Annual dividends pershare Current market price per share A measure of the return that shareholders receive in the form of dividends. A "typical" dividend yield is 2% to 3%. The dividend yield for fast-growth companies is often below 1%; the dividend yield for slow-growth companies can run 4% to 5%. 2. Price-to-earnings (P/E) ratio Current market price pershare Earnings per share P/E ratios above 20 indicate strong investor confidence in a firm's outlook and earnings growth; firms whose future earnings are at risk or likely to grow slowly typically have ratios below 12. 3. Dividend payout ratio Annual dividends per share Earnings per share Indicates the percentage of after-tax profits paid out as dividends. 4. Internal cash flow After-tax profits + Depreciation 5. Free cash flow After-tax profits + Depreciation - Capital expenditures - Dividends A rough estimate of the cash a company's business is generating after payment of operating expenses, interest, and taxes. Such amounts can be used for dividend payments or funding capital expenditures. A rough estimate of the cash a company's business is generating after payment of operating expenses, interest, taxes, dividends, and desirable reinvestments in the business. The larger a company's free cash flow, the greater its ability to internally fund new strategic initiatives, repay debt, make new acquisitions, repurchase shares of stock, or increase dividend payments


