

Question: 2 . Using the same data in the Table 1 , now we test a list of threshold used to make final positive / negative
Using the same data in the Table now we test a list of threshold used to make final positive negative calls. Threshold list is
a please find TP FP TN FN and Sensitivity TP Rate: TPR Specificity TN Rate: TNR and False PositiveFPR: TNR fill in the table below.
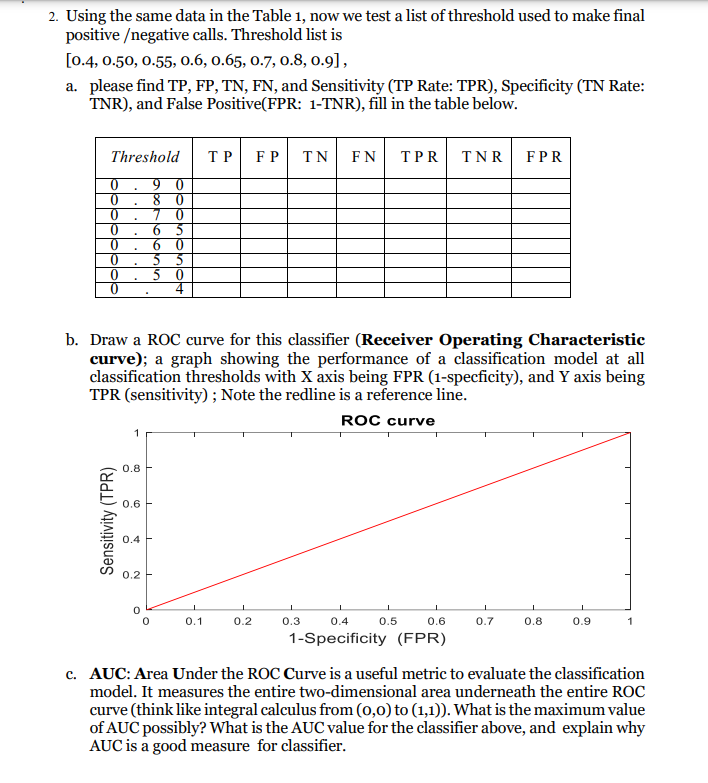
b Draw a ROC curve for this classifier Receiver Operating Characteristic curve; a graph showing the performance of a classification model at all classification thresholds with X axis being FPR specficity and Y axis being TPR sensitivity ; Note the redline is a reference line.
c AUC: Area Under the ROC Curve is a useful metric to evaluate the classification model. It measures the entire twodimensional area underneath the entire ROC curve think like integral calculus from to What is the maximum value of AUC possibly? What is the AUC value for the classifier above, and explain why AUC is a good measure for classifier.
Step by Step Solution
There are 3 Steps involved in it
1 Expert Approved Answer
Step: 1 Unlock

Question Has Been Solved by an Expert!
Get step-by-step solutions from verified subject matter experts
Step: 2 Unlock
Step: 3 Unlock