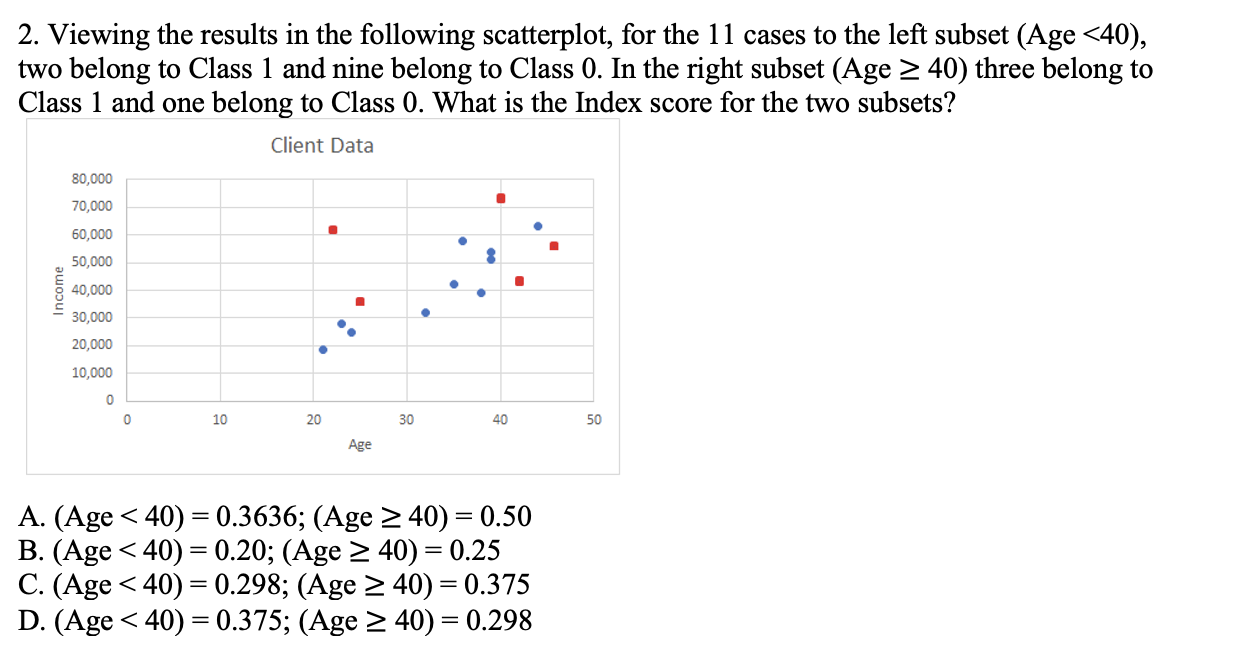
Question: 2. Viewing the results in the following scatterplot, for the 11 cases to the left subset (Age 40) three belong to Class 1 and one

2. Viewing the results in the following

2. Viewing the results in the following scatterplot, for the 11 cases to the left subset (Age 40) three belong to Class 1 and one belong to Class 0. What is the Index score for the two subsets? Client Data 80,000 70,000 60,000 50,000 8 . Income 40,000 . 30,000 20,000 10,000 0 0 10 20 30 40 50 Age A. (Age 40) = 0.50 B. (Age 40) = 0.25 C. (Age 40) = 0.375 D. (Age 40) = 0.298

Step by Step Solution

There are 3 Steps involved in it

1 Expert Approved Answer
Step: 1 Unlock blur-text-image
Question Has Been Solved by an Expert!

Get step-by-step solutions from verified subject matter experts

Step: 2 Unlock
Step: 3 Unlock

Students Have Also Explored These Related General Management Questions!