

Question: 2. visualizing data Choose one or two quantitative or qualitative variables. You will be formulating a hypothesis about one or two parameters and testing it
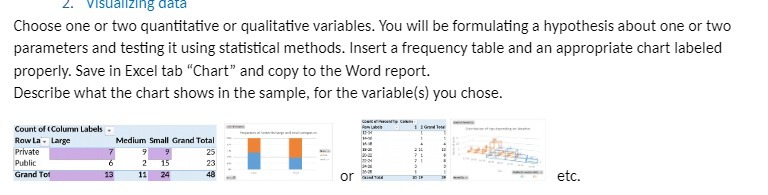

2. visualizing data Choose one or two quantitative or qualitative variables. You will be formulating a hypothesis about one or two parameters and testing it using statistical methods. Insert a frequency table and an appropriate chart labeled properly. Save in Excel tab "Chart" and copy to the Word report. Describe what the chart shows in the sample, for the variable(s) you chose. Count of ( Column Labels - IHH Row La - Large Medium Small Grand Total Private Public 15 23 Grand Toi 13 11 24 or etc
Step by Step Solution
There are 3 Steps involved in it
1 Expert Approved Answer
Step: 1 Unlock

Question Has Been Solved by an Expert!
Get step-by-step solutions from verified subject matter experts
Step: 2 Unlock
Step: 3 Unlock