

Question: 2. We want to create a one variable data table that will display values of Taxable Income (cell 03), versus Federal Tax (cell F18) and
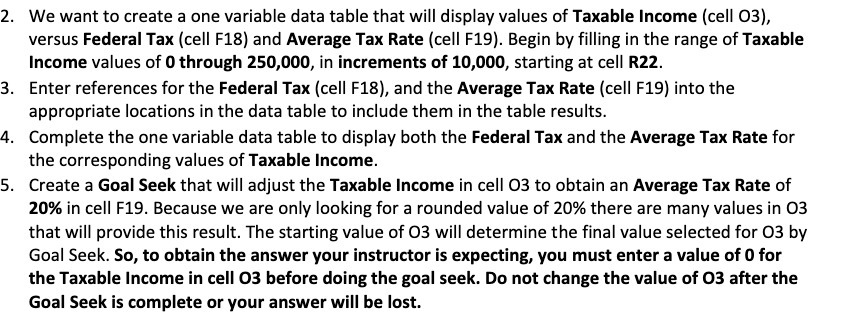
2. We want to create a one variable data table that will display values of Taxable Income (cell 03), versus Federal Tax (cell F18) and Average Tax Rate (cell F19). Begin by filling in the range of Taxable Income values of 0 through 250,000, in increments of 10,000, starting at cell R22. 3. Enter references for the Federal Tax (cell F18), and the Average Tax Rate (cell F19) into the appropriate locations in the data table to include them in the table results. 4. Complete the one variable data table to display both the Federal Tax and the Average Tax Rate for the corresponding values of Taxable Income. 5. Create a Goal Seek that will adjust the Taxable Income in cell 03 to obtain an Average Tax Rate of 20% in cell F19. Because we are only looking for a rounded value of 20% there are many values in 03 that will provide this result. The starting value of 03 will determine the final value selected for 03 by Goal Seek. So, to obtain the answer your instructor is expecting, you must enter a value of 0 for the Taxable Income in cell 03 before doing the goal seek. Do not change the value of 03 after the Goal Seek is complete or your answer will be lost
Step by Step Solution
There are 3 Steps involved in it

Get step-by-step solutions from verified subject matter experts