

Question: 2. What does the graph look like? 3. Predict the value of y for x=3 Find the equation of the regression line for the given
2. What does the graph look like? 3. Predict the value of y for x=3
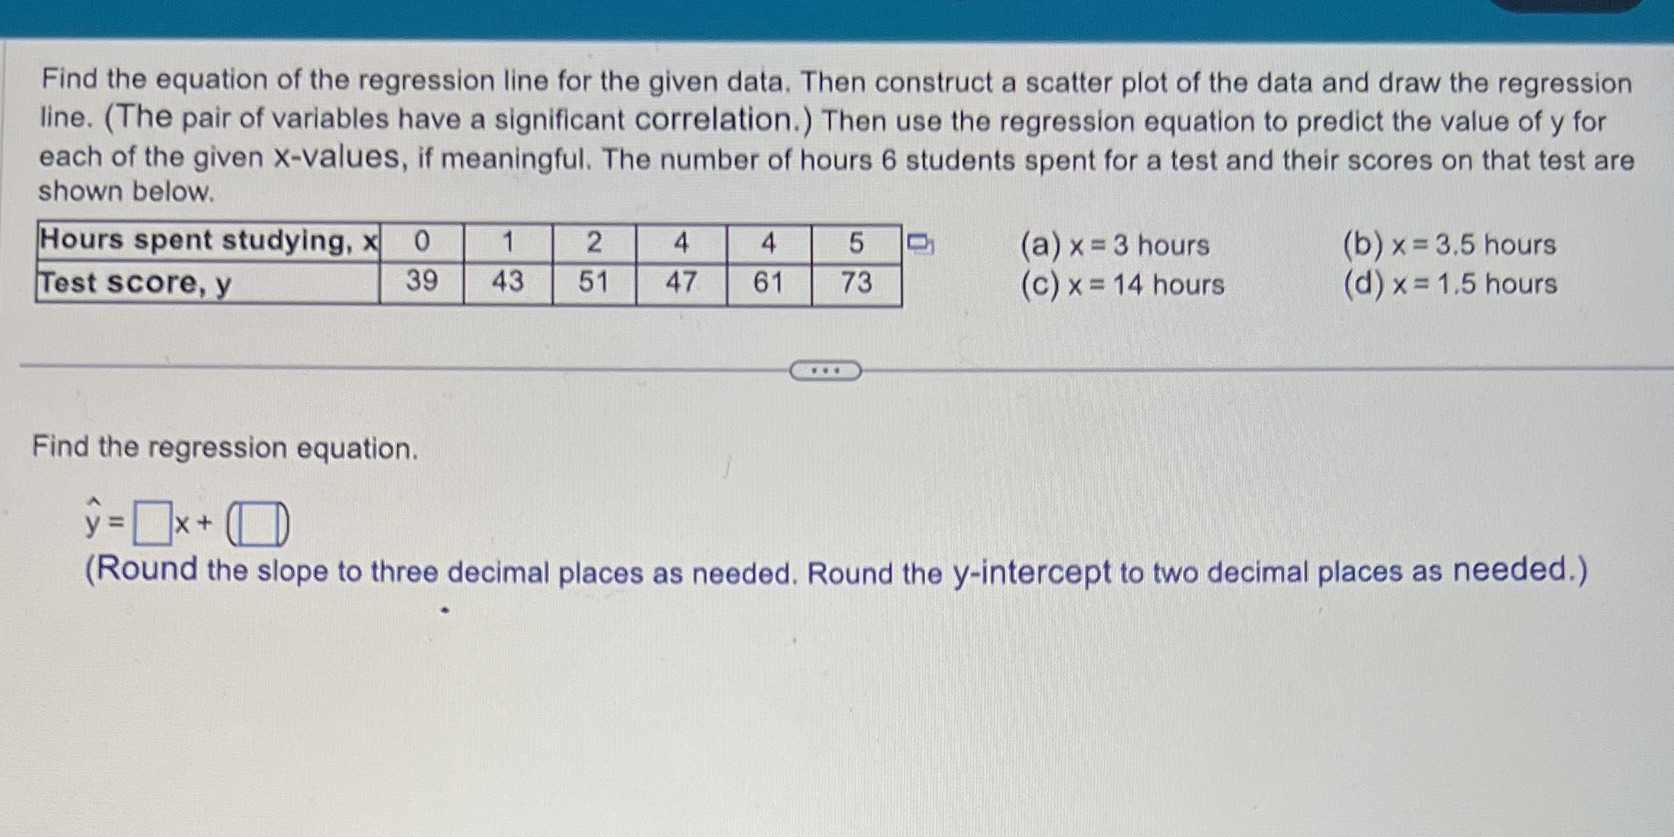
Find the equation of the regression line for the given data. Then construct a scatter plot of the data and draw the regression line. (The pair of variables have a significant correlation.) Then use the regression equation to predict the value of y for each of the given x-values, if meaningful. The number of hours 6 students spent for a test and their scores on that test are shown below. Hours spent studying, x 0 1 2 4 4 5 (a) x = 3 hours (b) x = 3.5 hours Test score, y 39 43 51 47 61 73 (c) x = 14 hours (d) x = 1.5 hours Find the regression equation. y = x + (ID (Round the slope to three decimal places as needed. Round the y-intercept to two decimal places as needed.)
Step by Step Solution
There are 3 Steps involved in it

Get step-by-step solutions from verified subject matter experts