

Question: 2. What is the total projected annual dollar usage? Round your answer to the nearest cent. $ 3. Complete the following table by entering the
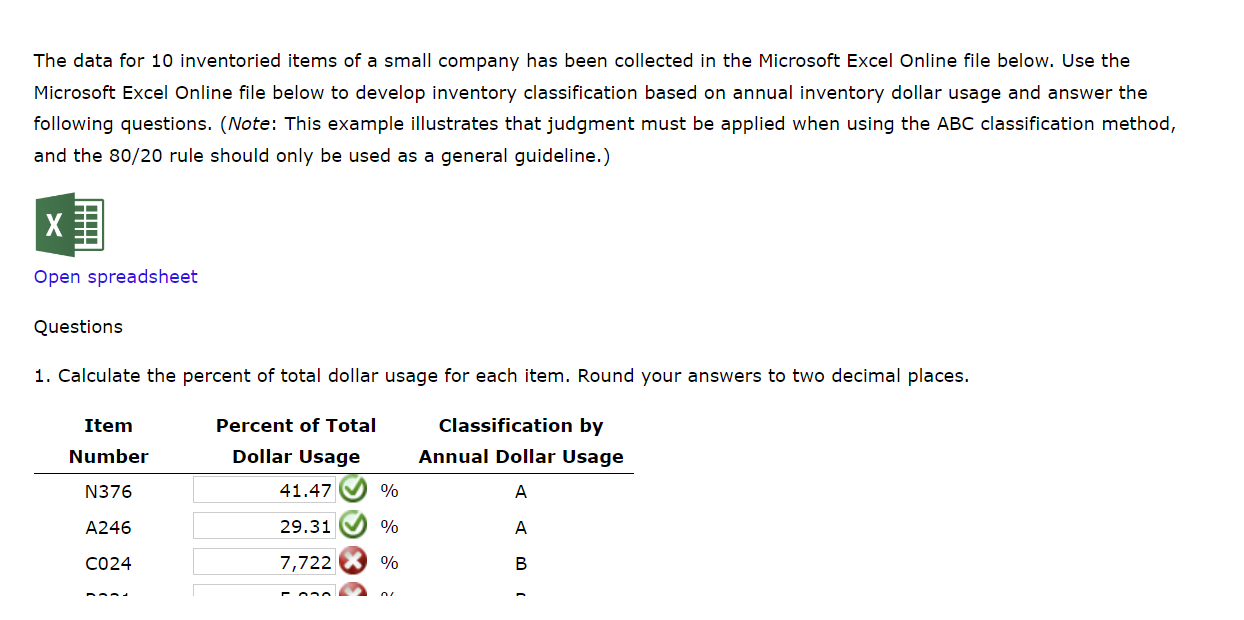
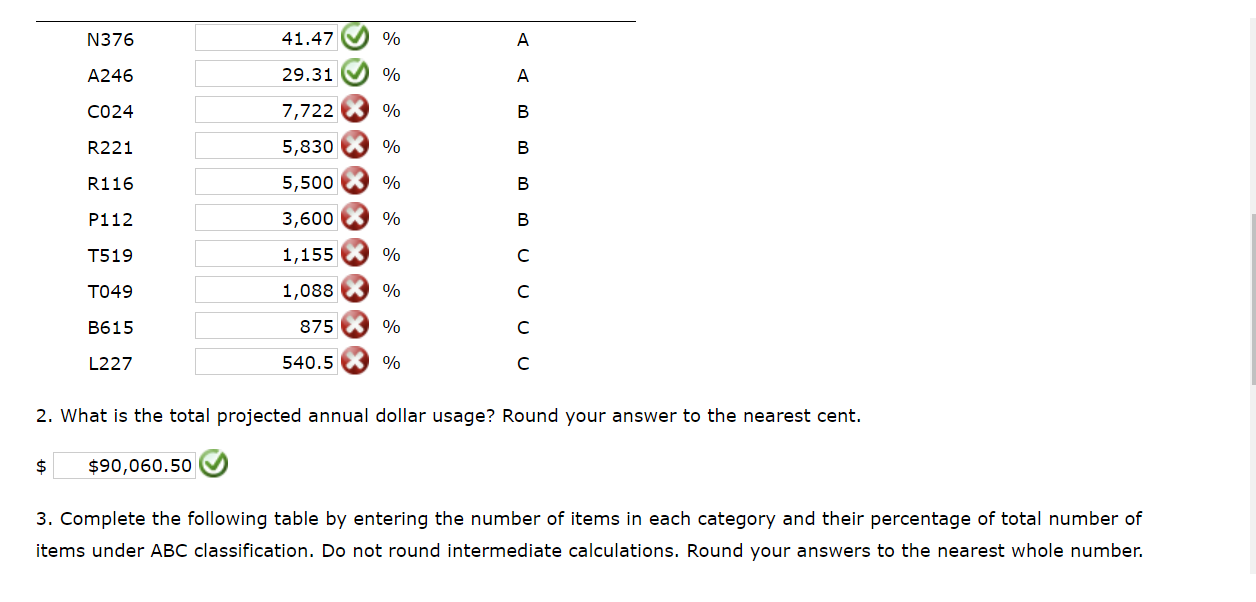
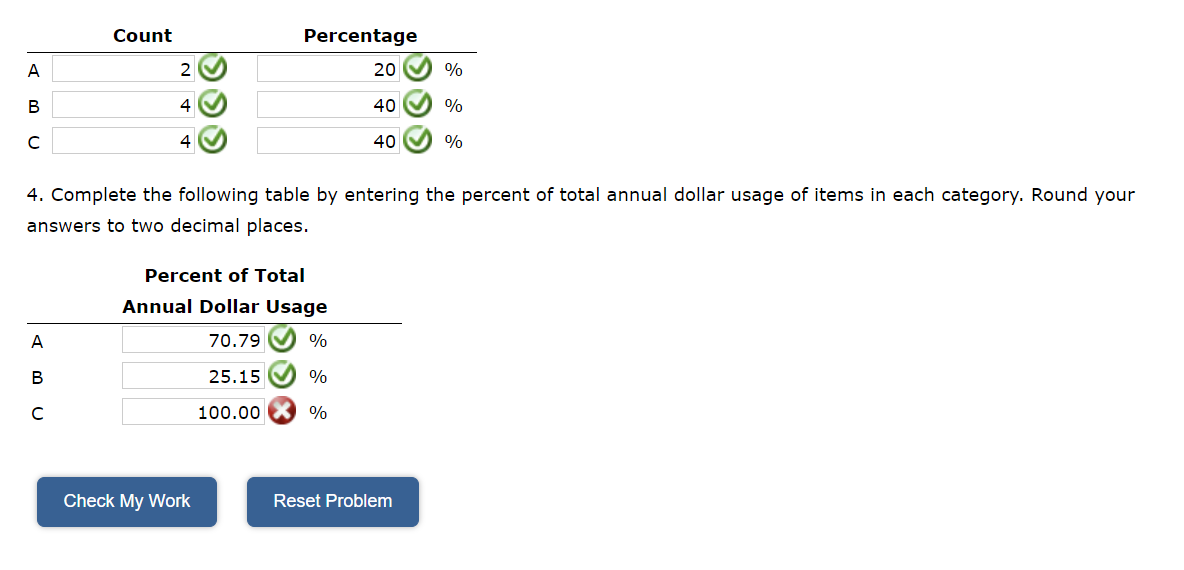
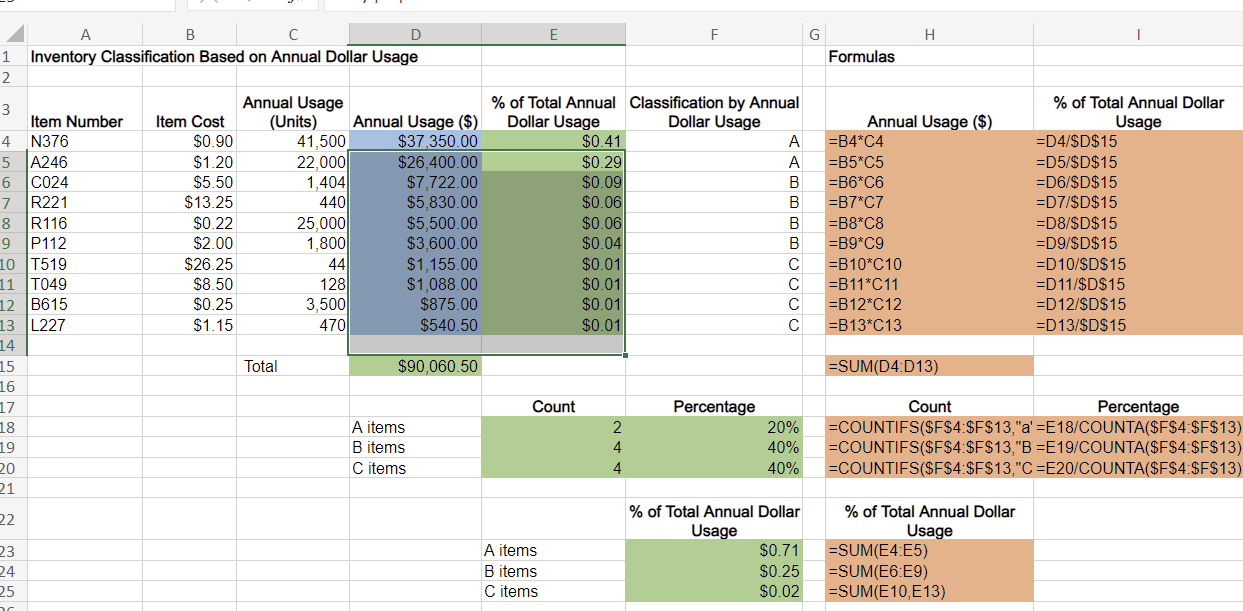
2. What is the total projected annual dollar usage? Round your answer to the nearest cent. $ 3. Complete the following table by entering the number of items in each category and their percentage of total number of items under ABC classification. Do not round intermediate calculations. Round your answers to the nearest whole number. The data for 10 inventoried items of a small company has been collected in the Microsoft Excel Online file below. Use the Microsoft Excel Online file below to develop inventory classification based on annual inventory dollar usage and answer the following questions. (Note: This example illustrates that judgment must be applied when using the ABC classification method, and the 80/20 rule should only be used as a general guideline.) Open spreadsheet Questions 1. Calculate the percent of total dollar usage for each item. Round your answers to two decimal places. \begin{tabular}{|c|c|c|c|c|c|c|c|c|} \hline & A & B & C & D & E & F & G & I \\ \hline & \multicolumn{4}{|c|}{ Inventory Classification Based on Annual Dollar Usage } & & & \multirow[t]{2}{*}{ Formulas } & \\ \hline & & & & & & & & \\ \hline & Item Number & Item Cost & \begin{tabular}{c} Annual Usage \\ (Units) \end{tabular} & Annual Usage (\$) & \begin{tabular}{c} % of Total Annual \\ Dollar Usage \end{tabular} & \begin{tabular}{c} Classification by Annual \\ Dollar Usage \end{tabular} & Annual Usage (\$) & \begin{tabular}{c} % of Total Annual Dollar \\ Usage \end{tabular} \\ \hline & N376 & $0.90 & 41,500 & $37,350.00 & $0.41 & A & =B4C4 & =D4/$D$15 \\ \hline & A246 & $1.20 & 22,000 & $26,400.00 & $0.29 & A & =B5C5 & =D5/$D$15 \\ \hline & C024 & $5.50 & 1,404 & $7,722.00 & $0.09 & B & =B6C6 & =D6/ \$D $15 \\ \hline & R221 & $13.25 & 440 & $5,830.00 & $0.06 & B & =B7C7 & =D7/$D$15 \\ \hline & R116 & $0.22 & 25,000 & $5,500.00 & $0.06 & B & =B8C8 & =D8/$D$15 \\ \hline & P112 & $2.00 & 1,800 & $3,600.00 & $0.04 & B & =B9C9 & =D9/ \$D $15 \\ \hline & T519 & $26.25 & 44 & $1,155.00 & $0.01 & C & =B10C10 & =D10/ \$D\$15 \\ \hline & T049 & $8.50 & 128 & $1,088.00 & $0.01 & C & =B11C11 & =D11/ \$D\$15 \\ \hline & B615 & $0.25 & 3,500 & $875.00 & $0.01 & C & =B12C12 & =D12/ \$D\$ 15 \\ \hline & L227 & $1.15 & 470 & $540.50 & $0.01 & C & =B13C13 & =D13/SD$15 \\ \hline & & & & & & & & \\ \hline & & & Total & $90,060.50 & & & =SUM(D4:D13) & \\ \hline & & & & & & & & \\ \hline & & & & & Count & Percentage & Count & Percentage \\ \hline & & & & A items & 2 & 20% & = COUNTIFS ($F$4:$F$13,"a & i=E18/ COUNTA ($F$4:$F$13) \\ \hline & & & & B items & 4 & 40% & = COUNTIFS ($F$4:$F$13,"B & =E19/ COUNTA ($F$4:$F$13) \\ \hline & & & & C items & 4 & 40% & = COUNTIFS ($F$4:$F$13,"C & =E20/ COUNTA ($F$4:$F$13) \\ \hline & & & & & & & & \\ \hline & & & & & & \begin{tabular}{c} % of Total Annual Dollar \\ Usage \end{tabular} & \begin{tabular}{c} % of Total Annual Dollar \\ Usage \end{tabular} & \\ \hline & & & & & A items & $0.71 & = SUM(E4:E5) & \\ \hline & & & & & B items & $0.25 & = SUM(E6:E9) & \\ \hline & & & & & C items & $0.02 & =SUM(E10,E13) & \\ \hline \end{tabular} 4. Complete the following table by entering the percent of total annual dollar usage of items in each category. Round your answers to two decimal places
Step by Step Solution
There are 3 Steps involved in it

Get step-by-step solutions from verified subject matter experts