

Question: 2. Write a paragraph commenting on the main features of the following chart from Statistics Canada. Figure 2. Median employment income by educational qualification,
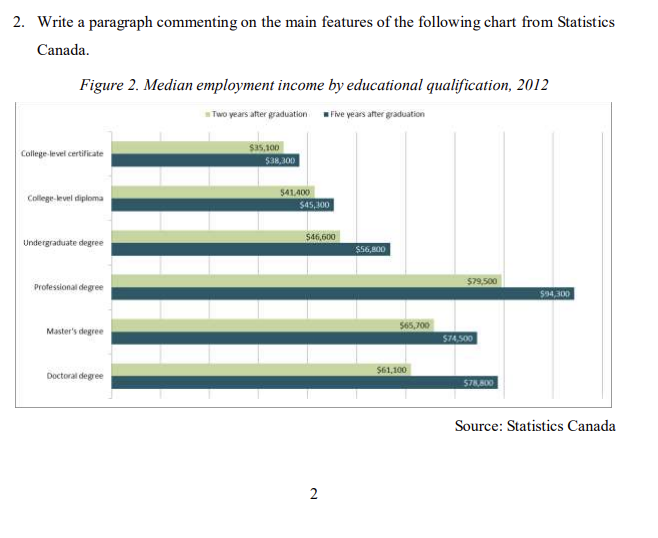
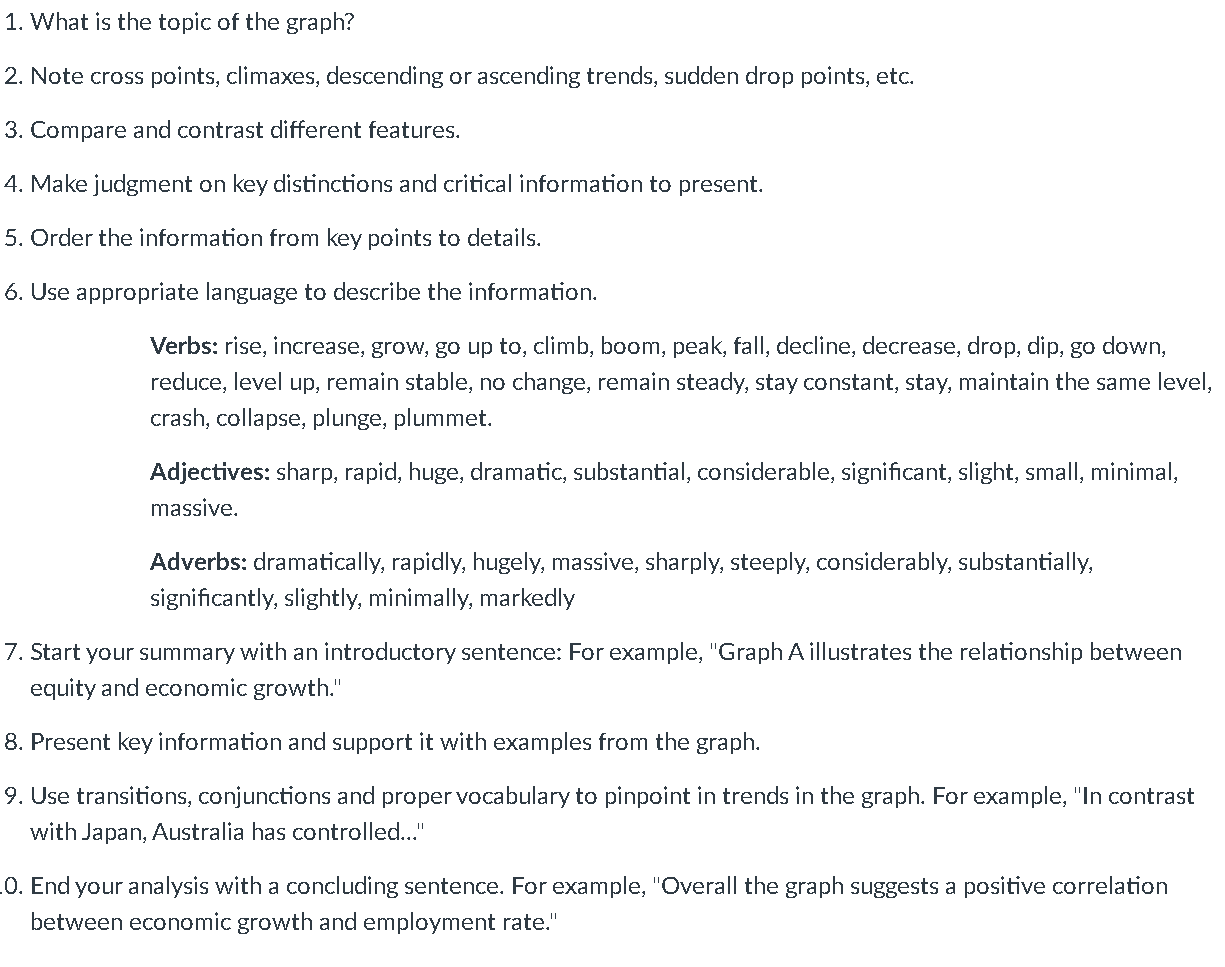
2. Write a paragraph commenting on the main features of the following chart from Statistics Canada. Figure 2. Median employment income by educational qualification, 2012 Two years after graduation Five years after graduation College-level certificate College-level diploma Undergraduate degree Professional degree Master's degree Doctoral degree $35,100 $38,300 $41,400 $45,300 $46,600 2 $56,800 565,700 $61,100 $79,500 $74,500 $78,800 $94,300 Source: Statistics Canada 1. What is the topic of the graph? 2. Note cross points, climaxes, descending or ascending trends, sudden drop points, etc. 3. Compare and contrast different features. 4. Make judgment on key distinctions and critical information to present. 5. Order the information from key points to details. 6. Use appropriate language to describe the information. Verbs: rise, increase, grow, go up to, climb, boom, peak, fall, decline, decrease, drop, dip, go down, reduce, level up, remain stable, no change, remain steady, stay constant, stay, maintain the same level, crash, collapse, plunge, plummet. Adjectives: sharp, rapid, huge, dramatic, substantial, considerable, significant, slight, small, minimal, massive. Adverbs: dramatically, rapidly, hugely, massive, sharply, steeply, considerably, substantially, significantly, slightly, minimally, markedly 7. Start your summary with an introductory sentence: For example, "Graph A illustrates the relationship between equity and economic growth." 8. Present key information and support it with examples from the graph. 9. Use transitions, conjunctions and proper vocabulary to pinpoint in trends in the graph. For example, "In contrast with Japan, Australia has controlled..." 0. End your analysis with a concluding sentence. For example, "Overall the graph suggests a positive correlation between economic growth and employment rate."
Step by Step Solution
There are 3 Steps involved in it
The chart from Statistics Canada presents the median employment income by educational qualification ... View full answer

Get step-by-step solutions from verified subject matter experts