

Question: 20 1 point The graph below has information gathered from the US Department of Health and Human Service reports regarding children in foster care over
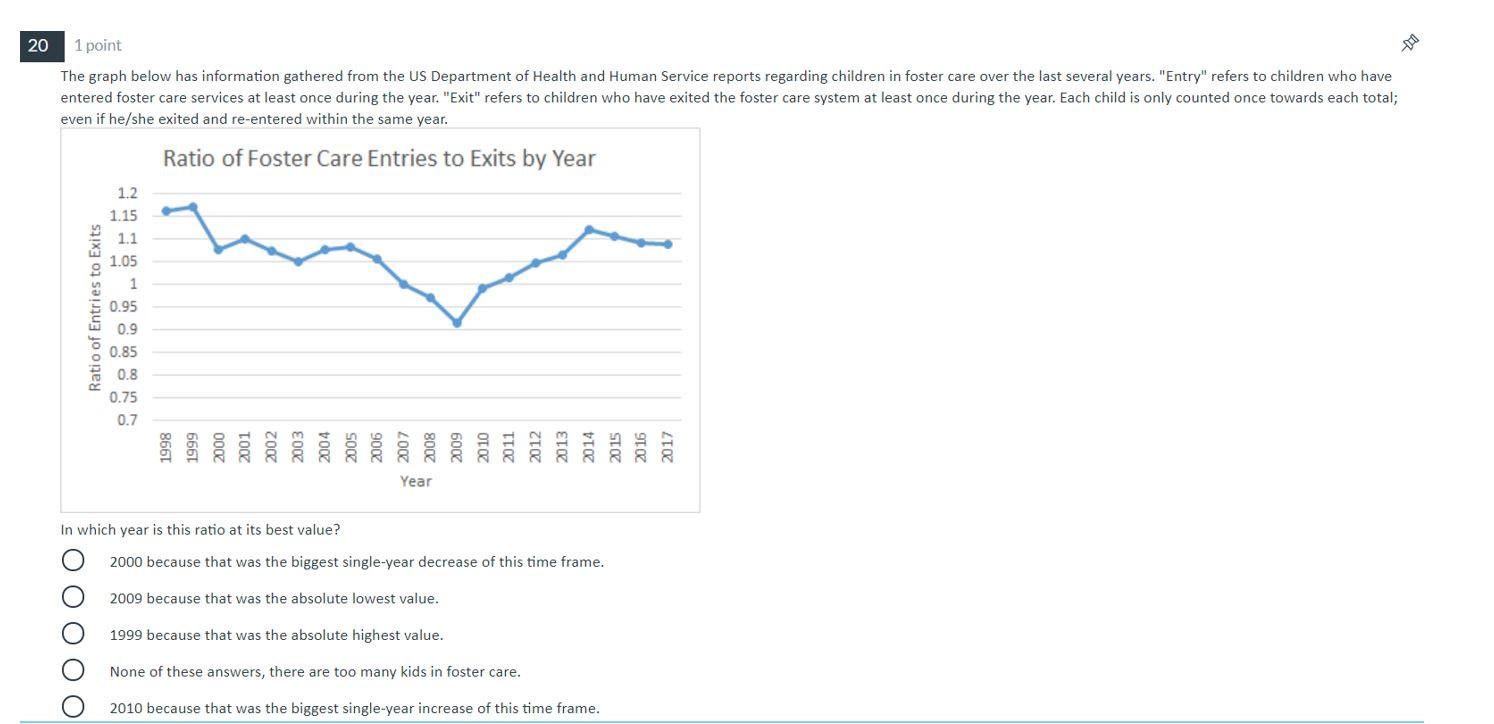
20 1 point The graph below has information gathered from the US Department of Health and Human Service reports regarding children in foster care over the last several years. "Entry" refers to children who have entered foster care services at least once during the year. "Exit" refers to children who have exited the foster care system at least once during the year. Each child is only counted once towards each total; even if he/she exited and re-entered within the same year. Ratio of Foster Care Entries to Exits by Year Ratio of Entries to Exits 1.2 1.15 1.1 1.05 1 0.95 0.9 0.85 0.8 0.75 0.7 1998 6661 2000 2001 2002 2003 2004 2005 2006 2007 2008 6002 2010 2011 2012 2013 2014 2015 2015 2017 Year In which year is this ratio at its best value? 2000 because that was the biggest single-year decrease of this time frame. 2009 because that was the absolute lowest value. 1999 because that was the absolute highest value. None of these answers, there are too many kids in foster care. 2010 because that was the biggest single-year increase of this time frame
Step by Step Solution
There are 3 Steps involved in it

Get step-by-step solutions from verified subject matter experts