

Question: 20 19 Maximum total head 18 17 16 Minimum total head 15 3,000 6.00) 12.000 FIGURE 3-16 System total head curves Flow rate, ma 2
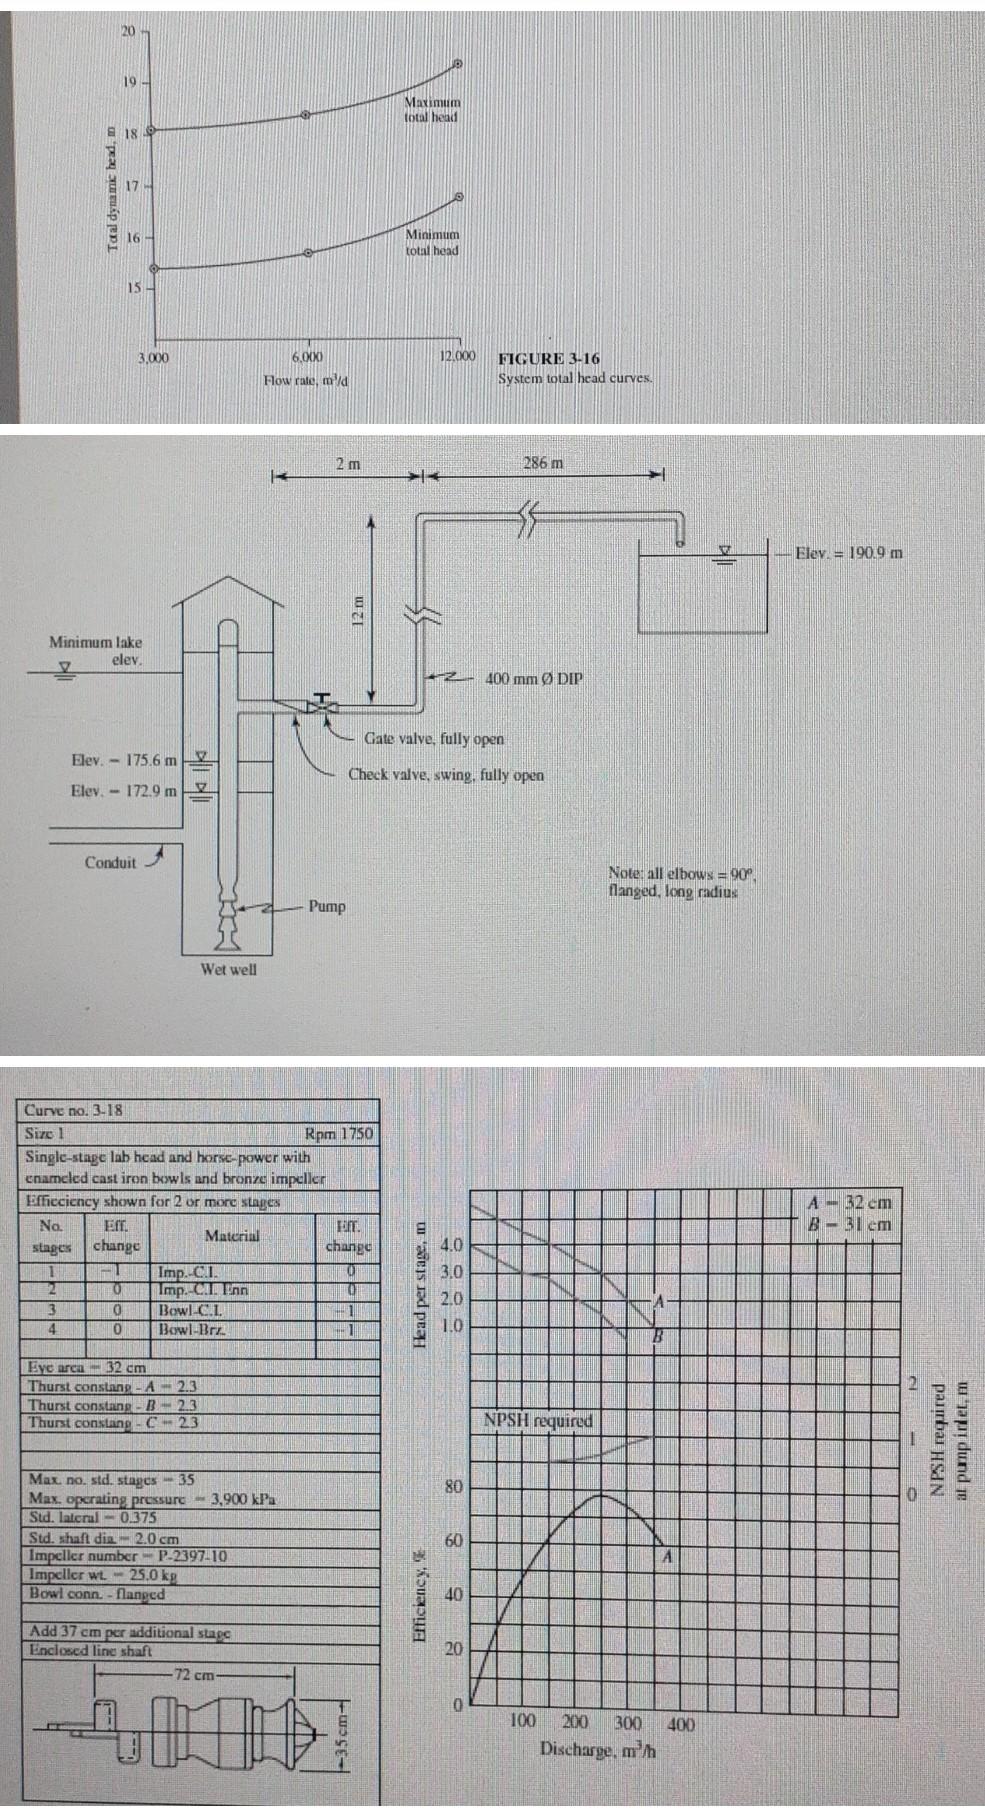
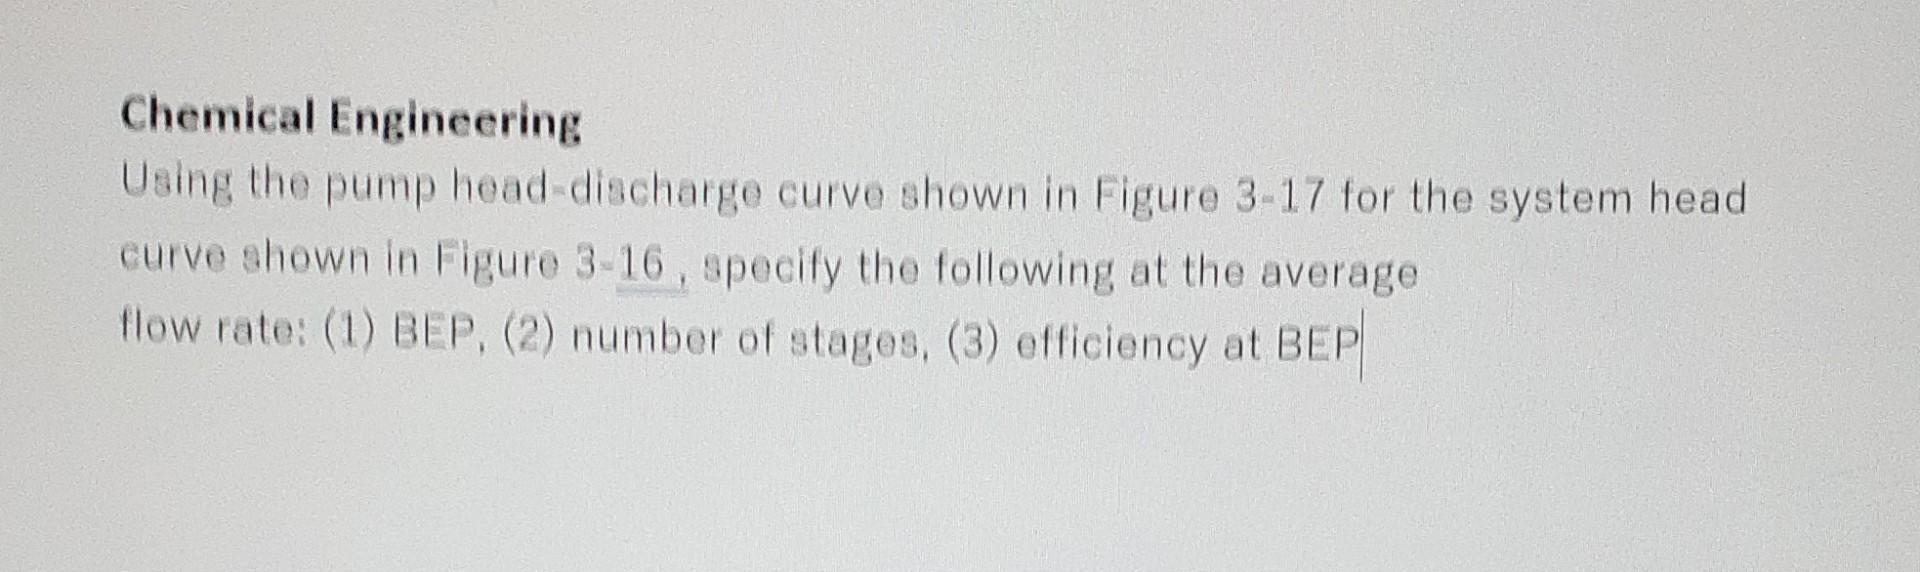
20 19 Maximum total head 18 17 16 Minimum total head 15 3,000 6.00) 12.000 FIGURE 3-16 System total head curves Flow rate, ma 2 m 286 m Elev = 190.9 m 12 m Minimum lake elev Z 400 mm DIN Gate valve, fully open Elev. - 175.6 m Check valve, swing, fully open Elev. - 172.9 m Conduit Note: all elbows = 90 flanged, long radius Pump Wet well Curve no. 3.18 Size 1 Rpm 1750 Single-stage lab head and horse-power with enameled cast iron bowls and bronze impeller Efficiency shown for 2 or more stages No. ENT. FET. Material stages change change 1 T Imp. C.T. 0 2 0 Imp. Cun. En TO 3 0 Bowl.C.I. 4 0 Bowl-Bre 1 A = 32 cm B = 31 cm Head per stage, m 4.0 3.0 2.0 1.0 Eye arcu 32 cm Thurst constang - A - 2.3 Thurst constang - B 2.3 Thurst constang- 23 NPSH required NPSH required al pump idet, m 80 Max. no. std. stages - 35 Max. operating pressure - 3.900 kPa Std. lateral 08375 Std. shaft die 2.0 cm Impeller number - P-2397.10 Impeller WL - 25.0 kg Bowl conn- flanged 60 40 Efficiency, Ada 37 cm per additional stage Enclosed line shaft 72 cm 20 un 100 200 300 400 Discharge. m'h Chemical Engineering Using the pump head discharge curve shown in Figure 3-17 for the system head curve shown in Figure 3-16, specify the following at the average flow rate: (1) BEP, (2) number of stages, (3) efficiency at BEP
Step by Step Solution
There are 3 Steps involved in it

Get step-by-step solutions from verified subject matter experts