

Question: 20 30 40 50 60 70 80 90 data Based on the box plot above, determine which quarter each number is in. Choose a
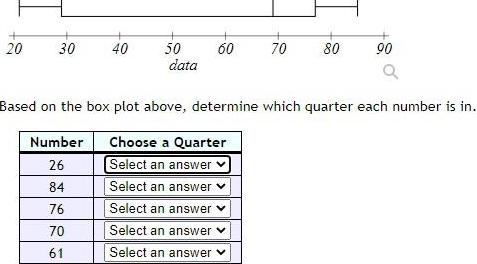
20 30 40 50 60 70 80 90 data Based on the box plot above, determine which quarter each number is in. Choose a Quarter Number 26 Select an answer 84 Select an answer 76 Select an answer 70 Select an answer 61 Select an answer
Step by Step Solution
There are 3 Steps involved in it
1 Expert Approved Answer
Step: 1 Unlock

Question Has Been Solved by an Expert!
Get step-by-step solutions from verified subject matter experts
Step: 2 Unlock
Step: 3 Unlock