

Question: 2000 2010 - . - . 2013 2014 2013 2013 2014 2016 2018 2017 2018 2010 - am - Como Compute the average retum for
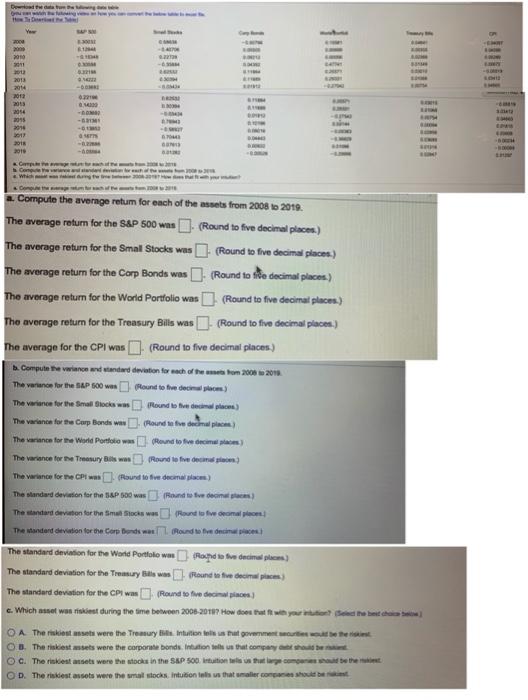
2000 2010 - . - . 2013 2014 2013 2013 2014 2016 2018 2017 2018 2010 - am - Como Compute the average retum for each of the assets from 2008 to 2019 The average return for the S&P 500 was. (Round to five decimal places) The average return for the Small Stocks was (Round to five decimal places) The average return for the Carp Bonds was (Round to site decimal places) The average return for the World Portfolio was (Round to five decimal places.) The average return for the Treasury Bills was - (Round to five decimal places) The average for the CPI was . (Round to five decimat pinces) Compute the variance and standard deviation for each of the met hom 2009 2010 The verance for the SAP 100 Flound to the decom) The variance for the Small Blocks was Pound to be decimal places) The variance for the Corp Bonds was (found of decimal places The warance for World Portfolio wa Rowed to five decima) The variance for the Treasury Biswas Round to five deca) The variance for eCP (Pound to finden) The Standard deviation for the S&P 500 was found for den The standard deviation for the time to wound to formal por The Mandard deviation for the Corp Beds we Round to free The standard deviation for the Word Portfolio wa Rond to fue decimal pem The standard deviation for the Tommy Hills was Pound a fie decimal picm) The standard deviation for the CPI was Round to fedecimale) c. Which met wan riskiest during the time between 2008-2011? How does that with your need the best cho O A The riskies we were the Tremury i Intuition fees that we were the OD The riskiest assets were the corporate bonds. Intation tells us that company should be OC. The riskestades were the stocks in the S&P 500 intuition is that are come the OD. The rest assets were the smal socks intuition is that we consider 2000 2010 - . - . 2013 2014 2013 2013 2014 2016 2018 2017 2018 2010 - am - Como Compute the average retum for each of the assets from 2008 to 2019 The average return for the S&P 500 was. (Round to five decimal places) The average return for the Small Stocks was (Round to five decimal places) The average return for the Carp Bonds was (Round to site decimal places) The average return for the World Portfolio was (Round to five decimal places.) The average return for the Treasury Bills was - (Round to five decimal places) The average for the CPI was . (Round to five decimat pinces) Compute the variance and standard deviation for each of the met hom 2009 2010 The verance for the SAP 100 Flound to the decom) The variance for the Small Blocks was Pound to be decimal places) The variance for the Corp Bonds was (found of decimal places The warance for World Portfolio wa Rowed to five decima) The variance for the Treasury Biswas Round to five deca) The variance for eCP (Pound to finden) The Standard deviation for the S&P 500 was found for den The standard deviation for the time to wound to formal por The Mandard deviation for the Corp Beds we Round to free The standard deviation for the Word Portfolio wa Rond to fue decimal pem The standard deviation for the Tommy Hills was Pound a fie decimal picm) The standard deviation for the CPI was Round to fedecimale) c. Which met wan riskiest during the time between 2008-2011? How does that with your need the best cho O A The riskies we were the Tremury i Intuition fees that we were the OD The riskiest assets were the corporate bonds. Intation tells us that company should be OC. The riskestades were the stocks in the S&P 500 intuition is that are come the OD. The rest assets were the smal socks intuition is that we consider
Step by Step Solution
There are 3 Steps involved in it

Get step-by-step solutions from verified subject matter experts