

Question: 2009 2010 72 a) Draw a bar graph that shows the entire scale from $0 to $8. Choose the correct graph below O A. Average
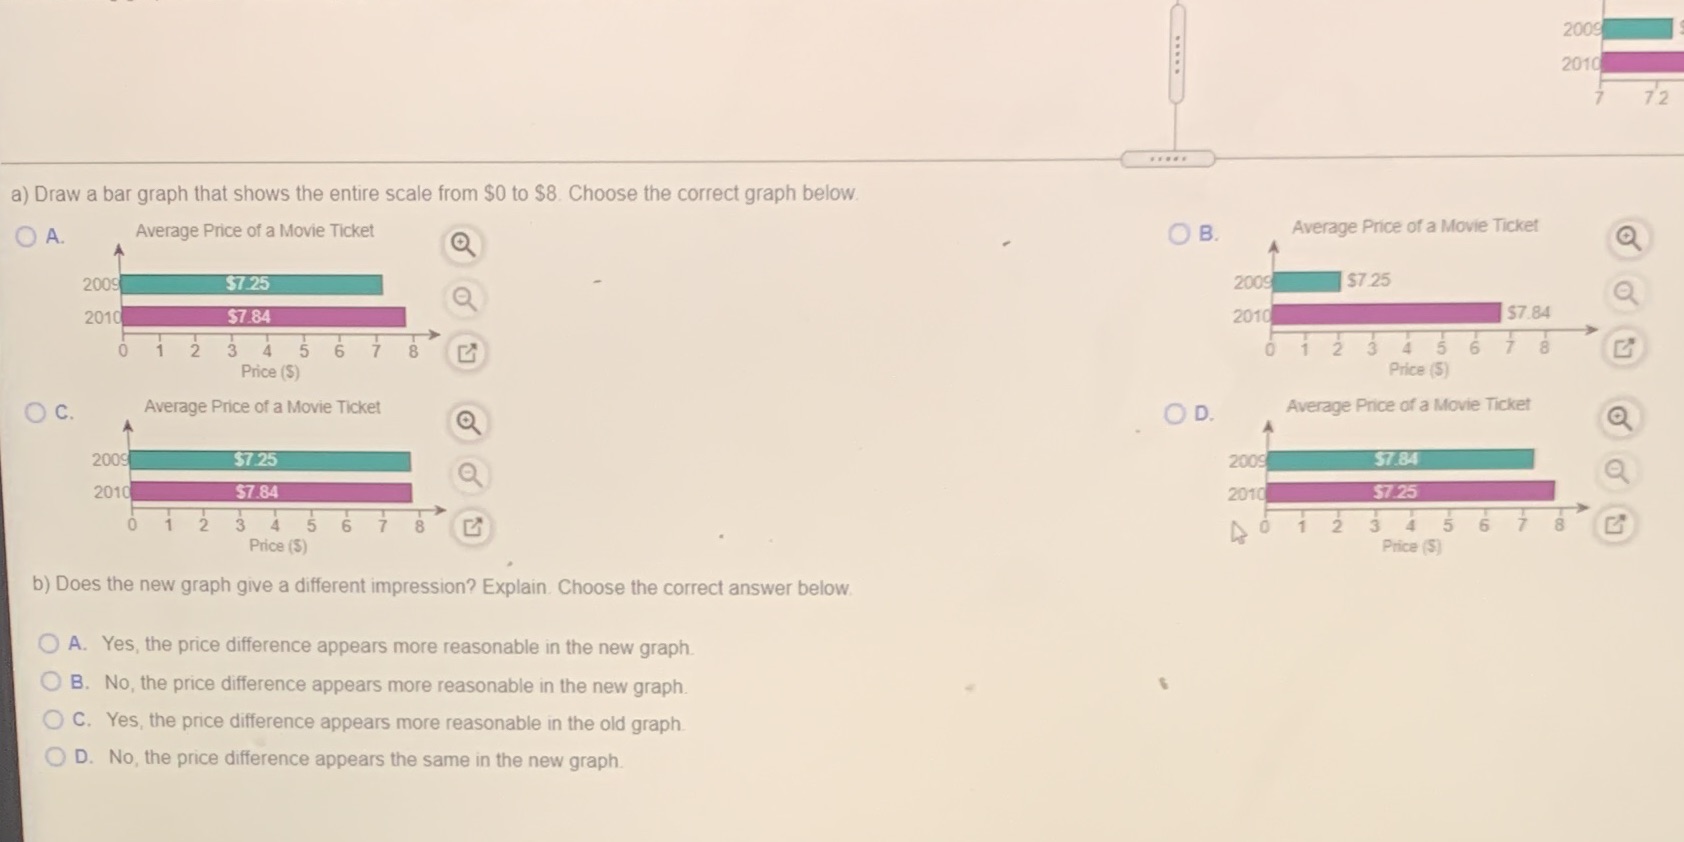
2009 2010 72 a) Draw a bar graph that shows the entire scale from $0 to $8. Choose the correct graph below O A. Average Price of a Movie Ticket O B. Average Price of a Movie Ticket 2009 $7.25 2009 $7 25 2010 $7.84 2010 $7 84 2 3 4 5 6 8 2 3 5 6 8 Price ($) Price (S) O C. Average Price of a Movie Ticket O D. Average Price of a Movie Ticket 2009 $7.25 2009 $7.84 2010 $7.84 2010 $7.25 2 3 4 5 6 0 1 2 3 4 5 6 8 Price (S) Price ($) b) Does the new graph give a different impression? Explain. Choose the correct answer below O A. Yes, the price difference appears more reasonable in the new graph. O B. No, the price difference appears more reasonable in the new graph. O C. Yes, the price difference appears more reasonable in the old graph. O D. No, the price difference appears the same in the new graph
Step by Step Solution
There are 3 Steps involved in it

Get step-by-step solutions from verified subject matter experts