

Question: 2009 2010 The table to the right shows the average back-to-school spending of households randomly sampled in 2009 and 2010, along with the population standard
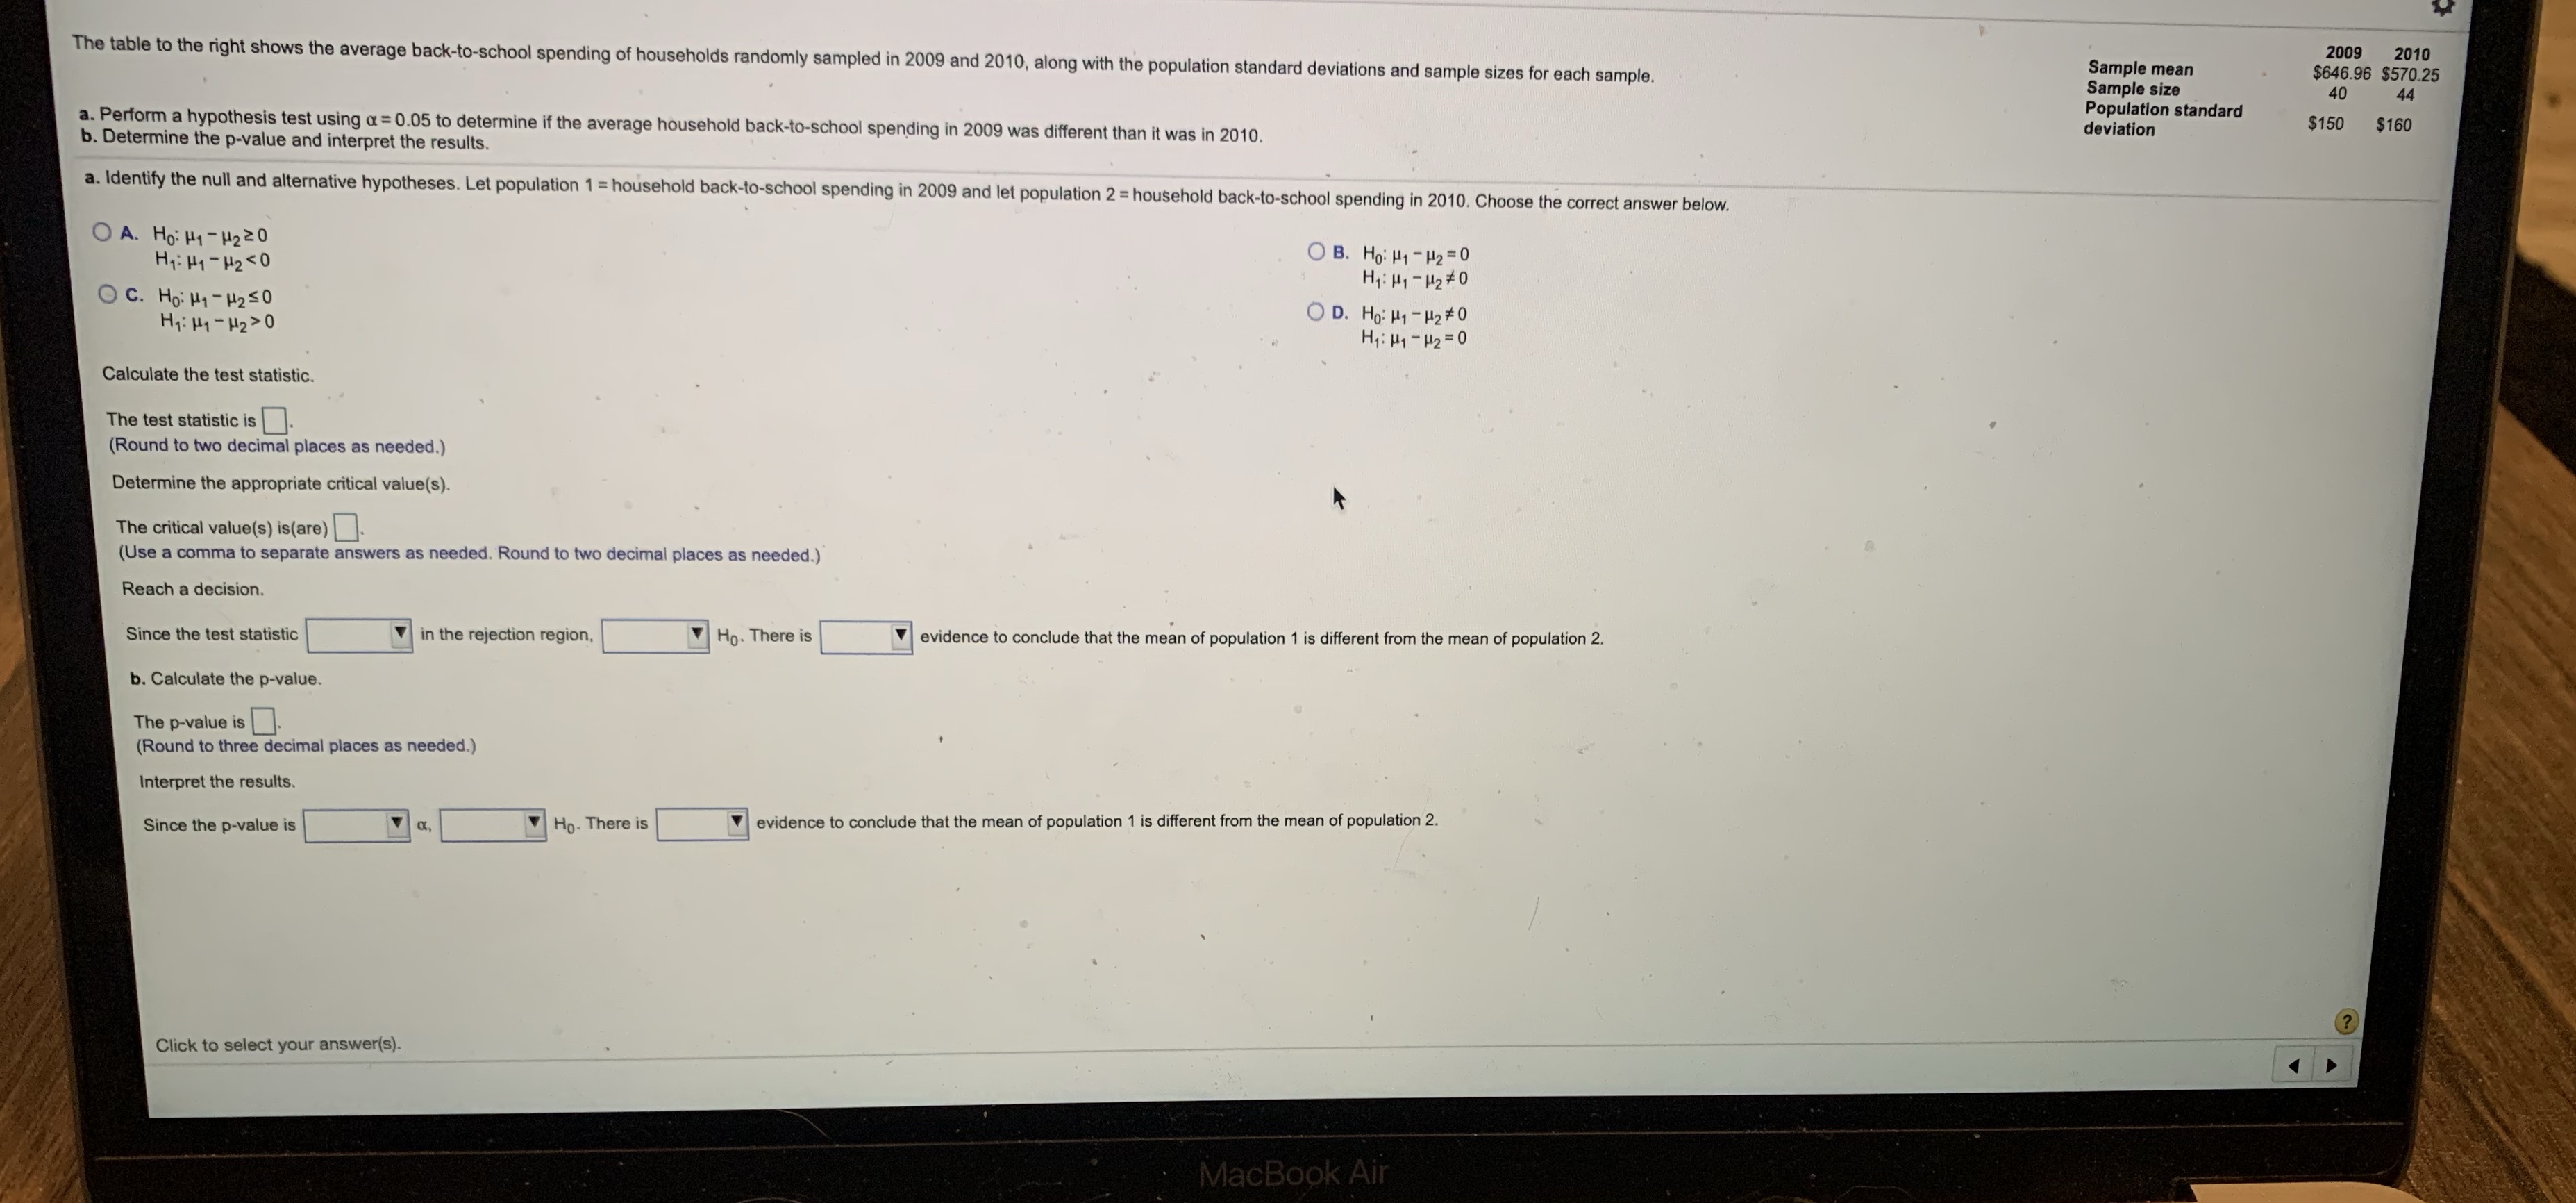
2009 2010 The table to the right shows the average back-to-school spending of households randomly sampled in 2009 and 2010, along with the population standard deviations and sample sizes for each sample. Sample mean 6 $570.2 Sample size 40 44 Population standard a. Perform a hypothesis test using a = 0.05 to determine if the average household back-to-school spending in 2009 was different than it was in 2010. deviation $150 $160 b. Determine the p-value and interpret the results. a. Identify the null and alternative hypotheses. Let population 1 = household back-to-school spending in 2009 and let population 2 = household back-to-school spending in 2010. Choose the correct answer below. O A. Ho: H1 - H2 20 H1: Hy- H250 OB. Ho: H1 - H2=0 H1: 141 - 12 # 0 O C. Ho: H1 - H250 OD. Ho: H1 - H2# 0 H1: Hy - H2>0 H1: 141 - H2= 0 Calculate the test statistic. The test statistic is. (Round to two decimal places as needed.) Determine the appropriate critical value(s). The critical value(s) is(are) . (Use a comma to separate answers as needed. Round to two decimal places as needed.) Reach a decision. Since the test statistic in the rejection region, Ho. There is evidence to conclude that the mean of population 1 is different from the mean of population 2. b. Calculate the p-value. The p-value is (Round to three decimal places as needed.) Interpret the results. Since the p-value is Ho. There is evidence to conclude that the mean of population 1 is different from the mean of population 2. (? Click to select your answer(s). MacBook Air
Step by Step Solution
There are 3 Steps involved in it

Get step-by-step solutions from verified subject matter experts