

Question: 2009 950 2010 960 2011 2012 962 968 678 688 686 695 The table to the right shows hypothetical values, in billions of dollars. Use
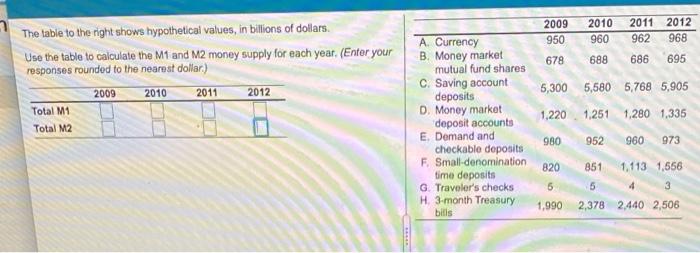
2009 950 2010 960 2011 2012 962 968 678 688 686 695 The table to the right shows hypothetical values, in billions of dollars. Use the table to calculate the M1 and M2 money supply for each year. (Enter your responses rounded to the nearest dollar) 2009 2010 2011 2012 Total M1 Total M2 5,300 5,580 5.768 5,905 1,220 1,251 1,280 1.335 A. Currency B. Money market mutual fund shares c. Saving account deposits D. Money market deposit accounts E. Demand and checkable deposits F. Small-denomination time deposits G. Traveler's checks H 3-month Treasury bills 980 952 960 973 820 5 851 1,113 1,656 5 4 3 2,378 2,440 2,506 1,990
Step by Step Solution
There are 3 Steps involved in it
1 Expert Approved Answer
Step: 1 Unlock

Question Has Been Solved by an Expert!
Get step-by-step solutions from verified subject matter experts
Step: 2 Unlock
Step: 3 Unlock