

Question: 2012 current ratio = 2011 current ratio = 2012 quick ratio = 2011 quick ratio = Which of the following best describes the company's current
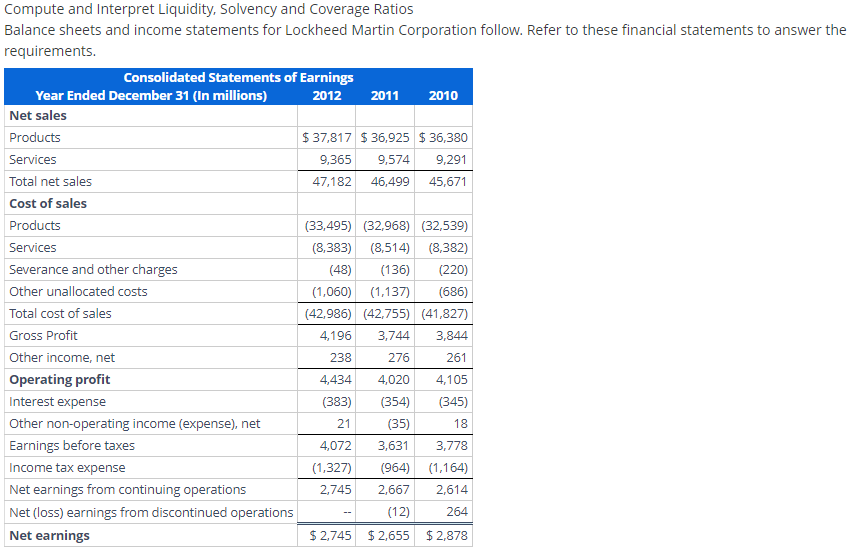
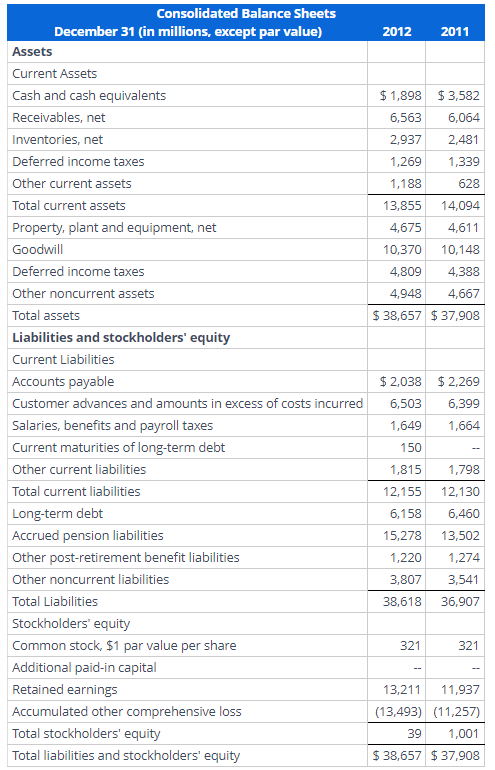
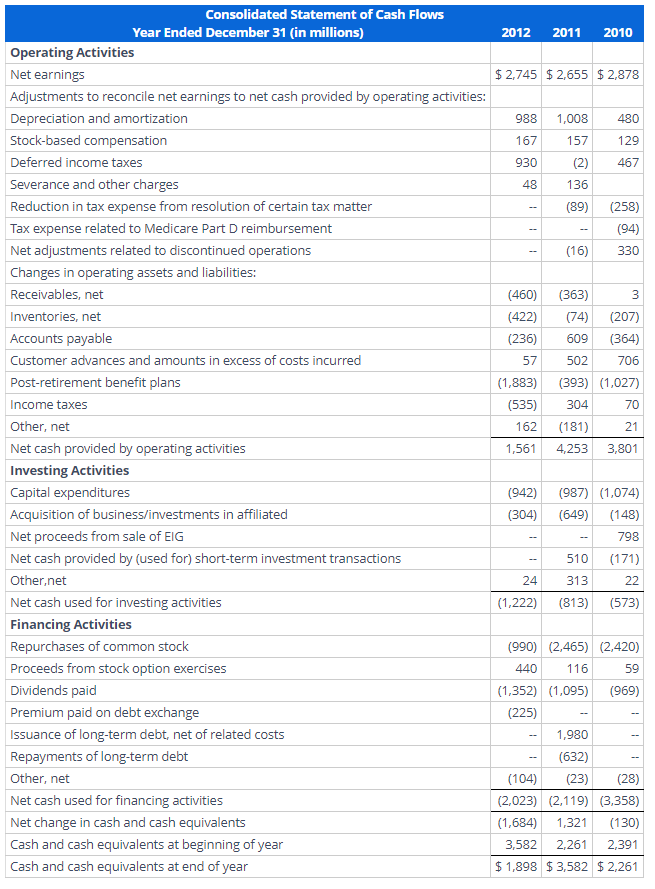
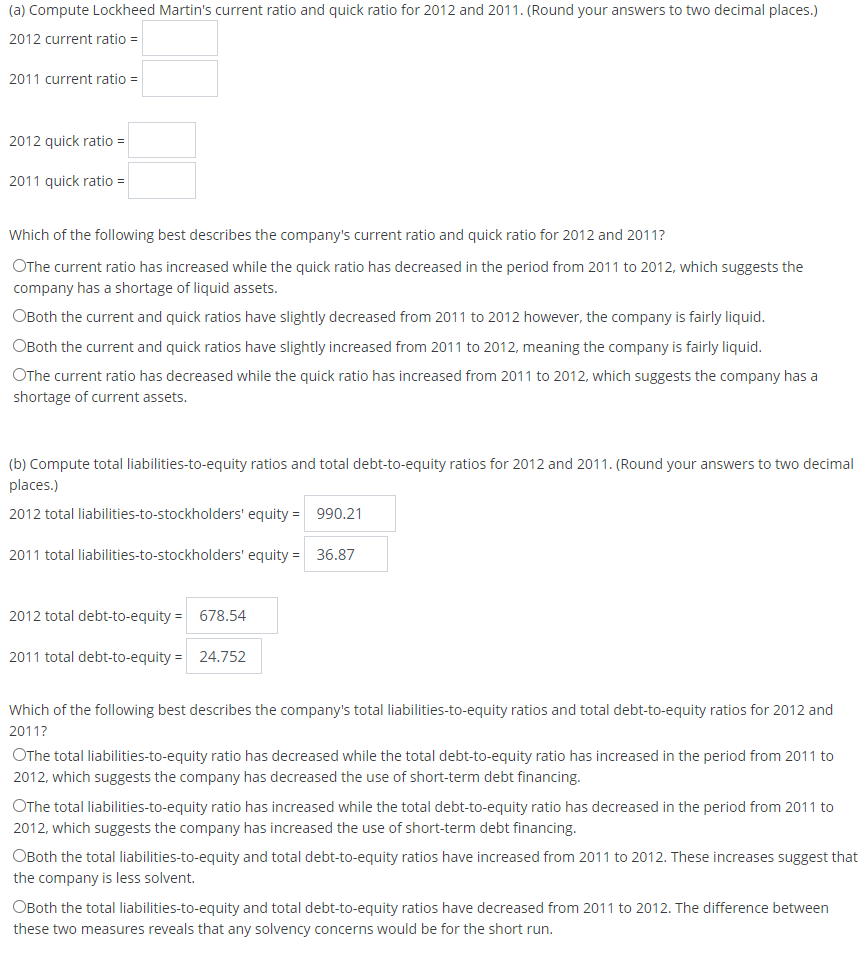
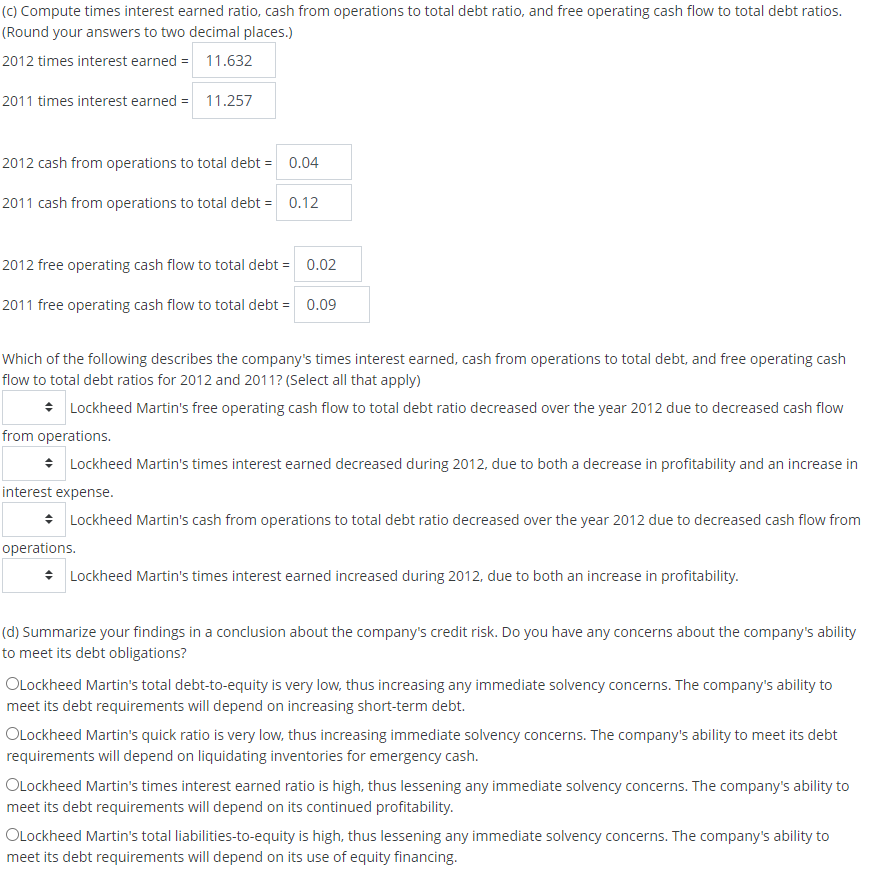
2012 current ratio = 2011 current ratio = 2012 quick ratio = 2011 quick ratio = Which of the following best describes the company's current ratio and quick ratio for 2012 and 2011 ? The current ratio has increased while the quick ratio has decreased in the period from 2011 to 2012, which suggests the company has a shortage of liquid assets. Both the current and quick ratios have slightly decreased from 2011 to 2012 however, the company is fairly liquid. Both the current and quick ratios have slightly increased from 2011 to 2012, meaning the company is fairly liquid. The current ratio has decreased while the quick ratio has increased from 2011 to 2012, which suggests the company has a shortage of current assets. (b) Compute total liabilities-to-equity ratios and total debt-to-equity ratios for 2012 and 2011. (Round your answers to two decima places.) 2012 total liabilities-to-stockholders' equity = 2011 total liabilities-to-stockholders' equity = 2012 total debt-to-equity = 2011 total debt-to-equity = Which of the following best describes the company's total liabilities-to-equity ratios and total debt-to-equity ratios for 2012 and 2011 ? OThe total liabilities-to-equity ratio has decreased while the total debt-to-equity ratio has increased in the period from 2011 to 2012, which suggests the company has decreased the use of short-term debt financing. OThe total liabilities-to-equity ratio has increased while the total debt-to-equity ratio has decreased in the period from 2011 to 2012, which suggests the company has increased the use of short-term debt financing. Both the total liabilities-to-equity and total debt-to-equity ratios have increased from 2011 to 2012. These increases suggest tha the company is less solvent. Both the total liabilities-to-equity and total debt-to-equity ratios have decreased from 2011 to 2012 . The difference between these two measures reveals that any solvency concerns would be for the short run. Compute and Interpret Liquidity, Solvency and Coverage Ratios Balance sheets and income statements for Lockheed Martin Corporation follow. Refer to these financial statements to answer the requirements. Which of the following describes the company's times interest earned, cash from operations to total debt, and free operating cash flow to total debt ratios for 2012 and 2011 ? (Select all that apply) Lockheed Martin's free operating cash flow to total debt ratio decreased over the year 2012 due to decreased cash flow from operations. Lockheed Martin's times interest earned decreased during 2012, due to both a decrease in profitability and an increase in interest expense. Lockheed Martin's cash from operations to total debt ratio decreased over the year 2012 due to decreased cash flow from operations. Lockheed Martin's times interest earned increased during 2012, due to both an increase in profitability. (d) Summarize your findings in a conclusion about the company's credit risk. Do you have any concerns about the company's ability to meet its debt obligations? Lockheed Martin's total debt-to-equity is very low, thus increasing any immediate solvency concerns. The company's ability to meet its debt requirements will depend on increasing short-term debt. Lockheed Martin's quick ratio is very low, thus increasing immediate solvency concerns. The company's ability to meet its debt requirements will depend on liquidating inventories for emergency cash. Lockheed Martin's times interest earned ratio is high, thus lessening any immediate solvency concerns. The company's ability to meet its debt requirements will depend on its continued profitability. Lockheed Martin's total liabilities-to-equity is high, thus lessening any immediate solvency concerns. The company's ability to meet its debt requirements will depend on its use of equity financing. \begin{tabular}{|c|c|c|c|} \hline \multicolumn{4}{|l|}{ Consolidated Statement of Cash Flows } \\ \hline Year Ended December 31 (in millions) & 2012 & 2011 & 2010 \\ \hline \multicolumn{4}{|l|}{ Operating Activities } \\ \hline Net earnings & $2,745 & $2,655 & $2,878 \\ \hline \multicolumn{4}{|c|}{ Adjustments to reconcile net earnings to net cash provided by operating activities: } \\ \hline Depreciation and amortization & 988 & 1,008 & 480 \\ \hline Stock-based compensation & 167 & 157 & 129 \\ \hline Deferred income taxes & 930 & (2) & 467 \\ \hline Severance and other charges & 48 & 136 & \\ \hline Reduction in tax expense from resolution of certain tax matter & - & (89) & (258) \\ \hline Tax expense related to Medicare Part D reimbursement & - & - & (94) \\ \hline Net adjustments related to discontinued operations & - & (16) & 330 \\ \hline \multicolumn{4}{|l|}{ Changes in operating assets and liabilities: } \\ \hline Receivables, net & (460) & (363) & 3 \\ \hline Inventories, net & (422) & (74) & (207) \\ \hline Accounts payable & (236) & 609 & (364) \\ \hline Customer advances and amounts in excess of costs incurred & 57 & 502 & 706 \\ \hline Post-retirement benefit plans & (1,883) & (393) & (1,027) \\ \hline Income taxes & (535) & 304 & 70 \\ \hline Other, net & 162 & (181) & 21 \\ \hline Net cash provided by operating activities & 1,561 & 4,253 & 3,801 \\ \hline \multicolumn{4}{|l|}{ Investing Activities } \\ \hline Capital expenditures & (942) & (987) & (1,074) \\ \hline Acquisition of business/investments in affiliated & (304) & (649) & (148) \\ \hline Net proceeds from sale of EIG & - & - & 798 \\ \hline Net cash provided by (used for) short-term investment transactions & - & 510 & (171) \\ \hline Other,net & 24 & 313 & 22 \\ \hline Net cash used for investing activities & (1,222) & (813) & (573) \\ \hline \multicolumn{4}{|l|}{ Financing Activities } \\ \hline Repurchases of common stock & (990) & (2,465) & (2,420) \\ \hline Proceeds from stock option exercises & 440 & 116 & 59 \\ \hline Dividends paid & (1,352) & (1,095) & (969) \\ \hline Premium paid on debt exchange & (225) & - & - \\ \hline Issuance of long-term debt, net of related costs & - & 1,980 & - \\ \hline Repayments of long-term debt & - & (632) & - \\ \hline Other, net & (104) & (23) & (28) \\ \hline Net cash used for financing activities & (2,023) & (2,119) & (3,358) \\ \hline Net change in cash and cash equivalents & (1,684) & 1,321 & (130) \\ \hline Cash and cash equivalents at beginning of year & 3,582 & 2,261 & 2,391 \\ \hline Cash and cash equivalents at end of year & $1,898 & $3,582 & $2,261 \\ \hline \end{tabular} \begin{tabular}{|c|c|c|} \hline ConsolidatedBalanceSheetsDecember31(inmillions,exceptparvalue) & 2012 & 2011 \\ \hline \multicolumn{3}{|l|}{ Assets } \\ \hline \multicolumn{3}{|l|}{ Current Assets } \\ \hline Cash and cash equivalents & $1,898 & $3,582 \\ \hline Receivables, net & 6,563 & 6,064 \\ \hline Inventories, net & 2,937 & 2,481 \\ \hline Deferred income taxes & 1,269 & 1,339 \\ \hline Other current assets & 1,188 & 628 \\ \hline Total current assets & 13,855 & 14,094 \\ \hline Property, plant and equipment, net & 4,675 & 4,611 \\ \hline Goodwill & 10,370 & 10,148 \\ \hline Deferred income taxes & 4,809 & 4,388 \\ \hline Other noncurrent assets & 4,948 & 4,667 \\ \hline Total assets & $38,657 & $37,908 \\ \hline \multicolumn{3}{|l|}{ Liabilities and stockholders' equity } \\ \hline \multicolumn{3}{|l|}{ Current Liabilities } \\ \hline Accounts payable & $2,038 & $2,269 \\ \hline Customer advances and amounts in excess of costs incurred & 6,503 & 6,399 \\ \hline Salaries, benefits and payroll taxes & 1,649 & 1,664 \\ \hline Current maturities of long-term debt & 150 & - \\ \hline Other current liabilities & 1,815 & 1,798 \\ \hline Total current liabilities & 12,155 & 12,130 \\ \hline Long-term debt & 6,158 & 6,460 \\ \hline Accrued pension liabilities & 15,278 & 13,502 \\ \hline Other post-retirement benefit liabilities & 1,220 & 1,274 \\ \hline Other noncurrent liabilities & 3,807 & 3,541 \\ \hline Total Liabilities & 38,618 & 36,907 \\ \hline \multicolumn{3}{|l|}{ Stockholders' equity } \\ \hline Common stock, \$1 par value per share & 321 & 321 \\ \hline Additional paid-in capital & -- & - \\ \hline Retained earnings & 13,211 & 11,937 \\ \hline Accumulated other comprehensive loss & (13,493) & (11,257) \\ \hline Total stockholders' equity & 39 & 1,001 \\ \hline Total liabilities and stockholders' equity & $38,657 & $37,908 \\ \hline \end{tabular}
Step by Step Solution
There are 3 Steps involved in it

Get step-by-step solutions from verified subject matter experts